SKIP TO CONTENT
Worksheet Generator
Subjects
Grades
Worksheets
Games
Build a Worksheet
More Resources
Roly Recommends
Subjects
Grades
Worksheets
Games
Build a Worksheet
More Resources
Roly Recommends
Showing Results for data graphing data : Page 4
Filters
350 results
Search for: data, graphing, data
✕
Common Core
✕
Clear All
350 results
Filters
Search for: data, graphing, data
✕
Common Core
✕
Subjects
Math
English Language Arts
Science
Social Studies
Grade Level
Pre-K
K
1st
2nd
3rd
4th
5th
6th
7th
8th
Early Childhood
Elementary School
Middle School
Resource Type
Worksheets
Games
Lesson Plans
Interactive Worksheets
Workbooks
Activities
Exercises
Songs
Offline Games
Teacher Resources
See more
Occasion
Easter
Summer
Back to School
Fall
Halloween
Winter
Holidays
Valentine's Day
Common Core
Yes
No
Roly Recommends
Social Emotional Learning
Game Type
Mazes
Printable Board Games
Word Puzzles
English Language Support
Yes
See More
Clear All
View 350 results
Showing Results for data graphing data : Page 4
Filters
350 results
Search for: data, graphing, data
✕
Common Core
✕
Clear All
350 results
Box and Whisker Plot
Worksheet
Box and Whisker Plot
Sixth Grade
Data and Graphing
Students learn how to find the five-number summary and create a box and whisker plot for given data sets.
Worksheet
Box and Whisker Plot
Worksheet
Box and Whisker Plot
Students learn how to find the five-number summary and create a box and whisker plot for given data sets.
Sixth Grade
Data and Graphing
Worksheet
Scaled Bar Graphs
Exercise
Scaled Bar Graphs
Third Grade
Data and Graphing
This exercise will clarify just how scaled bar graphs represent data found in math problems.
Exercise
Scaled Bar Graphs
Exercise
Scaled Bar Graphs
This exercise will clarify just how scaled bar graphs represent data found in math problems.
Third Grade
Data and Graphing
Exercise
Interquartile Range
Interactive Worksheet
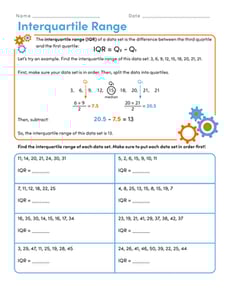
Interquartile Range
Sixth Grade
Statistics
In this sixth-grade statistics worksheet, students will practice finding the interquartile range of data sets.
Interactive Worksheet
Interquartile Range
Interactive Worksheet
Interquartile Range
In this sixth-grade statistics worksheet, students will practice finding the interquartile range of data sets.
Sixth Grade
Statistics
Interactive Worksheet
Creating Box Plots
Worksheet
Creating Box Plots
Sixth Grade
Data and Graphing
Learn to draw your own box plots to show data in this informative sixth-grade worksheet!
Worksheet
Creating Box Plots
Worksheet
Creating Box Plots
Learn to draw your own box plots to show data in this informative sixth-grade worksheet!
Sixth Grade
Data and Graphing
Worksheet
Analyzing a Census
Worksheet
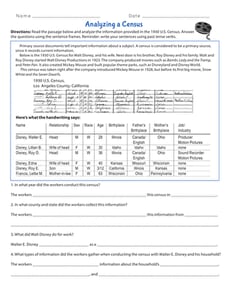
Analyzing a Census
Fourth Grade
Reading
It’s census time! Travel back to 1930 to analyze the census data for the household of Walt Disney.
Worksheet
Analyzing a Census
Worksheet
Analyzing a Census
It’s census time! Travel back to 1930 to analyze the census data for the household of Walt Disney.
Fourth Grade
Reading
Worksheet
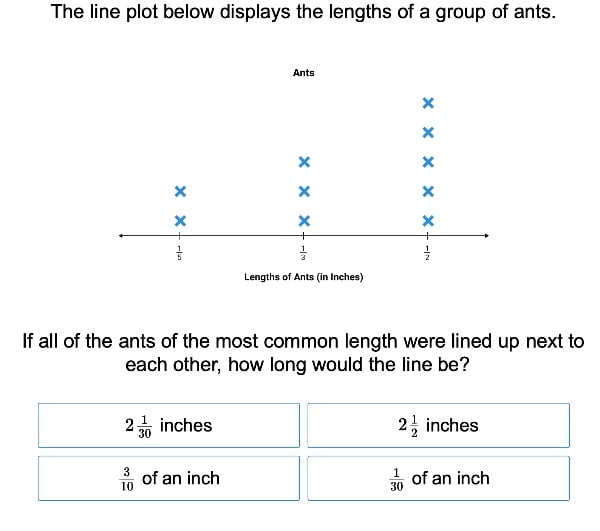
Line Plot Fractions
Worksheet
Line Plot Fractions
Fifth Grade
Fractions
Build your students' confidence in using fractions. With this worksheet, students will graph data of snowfall measurements on a line plot.
Worksheet
Line Plot Fractions
Worksheet
Line Plot Fractions
Build your students' confidence in using fractions. With this worksheet, students will graph data of snowfall measurements on a line plot.
Fifth Grade
Fractions
Worksheet
Weather Log
Worksheet
Weather Log
First Grade
Measurement
Rain or shine, get ready for some weather watching! Record data to observe the weather patterns over the course of a week.
Worksheet
Weather Log
Worksheet
Weather Log
Rain or shine, get ready for some weather watching! Record data to observe the weather patterns over the course of a week.
First Grade
Measurement
Worksheet
How Do You Measure Up?
Worksheet
How Do You Measure Up?
Fifth Grade
Fractions
Students will take practice measurements of real world objects and make a line plot of the data.
Worksheet
How Do You Measure Up?
Worksheet
How Do You Measure Up?
Students will take practice measurements of real world objects and make a line plot of the data.
Fifth Grade
Fractions
Worksheet
Record Your Fall Favorites
Worksheet
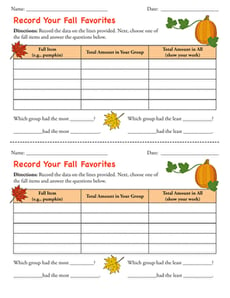
Record Your Fall Favorites
Second Grade
Data and Graphing
Use this template alongside the engaging lesson, “Let’s Graph Our Fall Favorites” to support kids in interpreting data.
Worksheet
Record Your Fall Favorites
Worksheet
Record Your Fall Favorites
Use this template alongside the engaging lesson, “Let’s Graph Our Fall Favorites” to support kids in interpreting data.
Second Grade
Data and Graphing
Worksheet
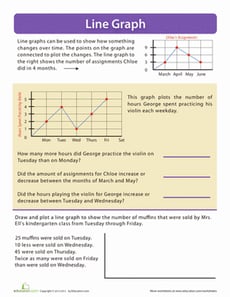
Line Graph
Worksheet
Line Graph
Third Grade
Data and Graphing
Introduce your math whiz to line graphs with this comprehensive lesson. Kids will read information on a line graph and plot some data as well.
Worksheet
Line Graph
Worksheet
Line Graph
Introduce your math whiz to line graphs with this comprehensive lesson. Kids will read information on a line graph and plot some data as well.
Third Grade
Data and Graphing
Worksheet
Let's Graph Our Fall Favorites!
Lesson Plan
Let's Graph Our Fall Favorites!
Second Grade
Data and Graphing
This engaging math lesson combines all of your kid's fall favorites as they learn to represent data using a bar graph.
Lesson Plan
Let's Graph Our Fall Favorites!
Lesson Plan
Let's Graph Our Fall Favorites!
This engaging math lesson combines all of your kid's fall favorites as they learn to represent data using a bar graph.
Second Grade
Data and Graphing
Lesson Plan
Peachy Line Plots
Worksheet
Peachy Line Plots
Fifth Grade
Fractions
Students create their own peachy word problems by filling in the blanks, then create a line plot with the data.
Worksheet
Peachy Line Plots
Worksheet
Peachy Line Plots
Students create their own peachy word problems by filling in the blanks, then create a line plot with the data.
Fifth Grade
Fractions
Worksheet
Dot Plots
Worksheet
Dot Plots
Sixth Grade
Data and Graphing
Covering a variety of interesting real-life contexts, this two-page math worksheet gives learners practice turning data sets into dot plots that are representative of each scenario.
Worksheet
Dot Plots
Worksheet
Dot Plots
Covering a variety of interesting real-life contexts, this two-page math worksheet gives learners practice turning data sets into dot plots that are representative of each scenario.
Sixth Grade
Data and Graphing
Worksheet
Picnic Bar Graph
Worksheet
Picnic Bar Graph
Second Grade
Data and Graphing
Which picnic games do you prefer? This bar graph shows some of the most popular picnic activities. Students will learn about analyzing data from a bar graph.
Worksheet
Picnic Bar Graph
Worksheet
Picnic Bar Graph
Which picnic games do you prefer? This bar graph shows some of the most popular picnic activities. Students will learn about analyzing data from a bar graph.
Second Grade
Data and Graphing
Worksheet
Mean, Median, and Mode
Interactive Worksheet
Mean, Median, and Mode
Sixth Grade
Statistics
Give students an introduction to the mean, median, and mode of various data sets with this sixth- and seventh-grade math worksheet.
Interactive Worksheet
Mean, Median, and Mode
Interactive Worksheet
Mean, Median, and Mode
Give students an introduction to the mean, median, and mode of various data sets with this sixth- and seventh-grade math worksheet.
Sixth Grade
Statistics
Interactive Worksheet
Foot Length: Create a Line Plot with Fractional Units
Worksheet
Foot Length: Create a Line Plot with Fractional Units
Fourth Grade
Data and Graphing
This worksheet challenges third graders to interpret the data and create a line plot with fractions, a key skill for fourth grade math.
Worksheet
Foot Length: Create a Line Plot with Fractional Units
Worksheet
Foot Length: Create a Line Plot with Fractional Units
This worksheet challenges third graders to interpret the data and create a line plot with fractions, a key skill for fourth grade math.
Fourth Grade
Data and Graphing
Worksheet
Line Plots and Fractional Operations
Exercise
Line Plots and Fractional Operations
Fifth Grade
Fractions
Understanding fractional operations will be much easier for students after they have learned how to use line plots to interpret data.
Exercise
Line Plots and Fractional Operations
Exercise
Line Plots and Fractional Operations
Understanding fractional operations will be much easier for students after they have learned how to use line plots to interpret data.
Fifth Grade
Fractions
Exercise
Line Plot Practice
Worksheet
Line Plot Practice
Second Grade
Data and Graphing
Use this worksheet to get your mathematicians comfortable and confident creating and interpreting line plots from a given set of data.
Worksheet
Line Plot Practice
Worksheet
Line Plot Practice
Use this worksheet to get your mathematicians comfortable and confident creating and interpreting line plots from a given set of data.
Second Grade
Data and Graphing
Worksheet
Pet Survey
Worksheet
Pet Survey
First Grade
Data and Graphing
Have your students survey one another about pet preferences using this interactive activity designed to practice representing and interpreting data.
Worksheet
Pet Survey
Worksheet
Pet Survey
Have your students survey one another about pet preferences using this interactive activity designed to practice representing and interpreting data.
First Grade
Data and Graphing
Worksheet
Comparing Pictographs: Taxi, Taxi
Worksheet
Comparing Pictographs: Taxi, Taxi
Third Grade
Addition
In this 3rd grade math worksheet, kids analyze and compare data in two pictographs in order to answer a set of word problems.
Worksheet
Comparing Pictographs: Taxi, Taxi
Worksheet
Comparing Pictographs: Taxi, Taxi
In this 3rd grade math worksheet, kids analyze and compare data in two pictographs in order to answer a set of word problems.
Third Grade
Addition
Worksheet
Pictograph Practice: Hamburger Cafe
Worksheet
Pictograph Practice: Hamburger Cafe
Second Grade
Data and Graphing
Pictographs are a great introduction to working with data and graphs. Kids help the hamburger cafe compare the number of hamburgers they sold using pictographs.
Worksheet
Pictograph Practice: Hamburger Cafe
Worksheet
Pictograph Practice: Hamburger Cafe
Pictographs are a great introduction to working with data and graphs. Kids help the hamburger cafe compare the number of hamburgers they sold using pictographs.
Second Grade
Data and Graphing
Worksheet
Ocean Lake River Questions
Worksheet
Ocean Lake River Questions
Second Grade
Data and Graphing
Do you prefer rivers, oceans, or lakes? Students will practice coming up with questions by analyzing the data given in this Venn diagram.
Worksheet
Ocean Lake River Questions
Worksheet
Ocean Lake River Questions
Do you prefer rivers, oceans, or lakes? Students will practice coming up with questions by analyzing the data given in this Venn diagram.
Second Grade
Data and Graphing
Worksheet
Practice Graphs
Worksheet
Practice Graphs
Second Grade
Data and Graphing
Kids practice representing a set of data using three kinds of graphs: a bar graph, pictograph, and pie graph.
Worksheet
Practice Graphs
Worksheet
Practice Graphs
Kids practice representing a set of data using three kinds of graphs: a bar graph, pictograph, and pie graph.
Second Grade
Data and Graphing
Worksheet
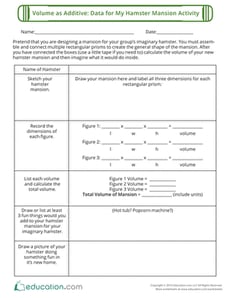
Volume as Additive: Data for My Hamster Mansion Activity
Worksheet
Volume as Additive: Data for My Hamster Mansion Activity
Fifth Grade
Measurement
Kids find the volume of rectangular prisms in this silly worksheet.
Worksheet
Volume as Additive: Data for My Hamster Mansion Activity
Worksheet
Volume as Additive: Data for My Hamster Mansion Activity
Kids find the volume of rectangular prisms in this silly worksheet.
Fifth Grade
Measurement
Worksheet
Eat Healthy Bar Graph
Worksheet
Eat Healthy Bar Graph
Third Grade
Data and Graphing
Use this relevant topic about healthy food to give your students practice reading a bar graph and answering questions about the data.
Worksheet
Eat Healthy Bar Graph
Worksheet
Eat Healthy Bar Graph
Use this relevant topic about healthy food to give your students practice reading a bar graph and answering questions about the data.
Third Grade
Data and Graphing
Worksheet
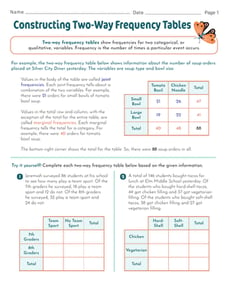
Constructing Two-Way Frequency Tables
Interactive Worksheet
Constructing Two-Way Frequency Tables
Eighth Grade
Data and Graphing
In this eighth-grade math worksheet, learners will then get to practice constructing two-way frequency tables given written descriptions of real-world data.
Interactive Worksheet
Constructing Two-Way Frequency Tables
Interactive Worksheet
Constructing Two-Way Frequency Tables
In this eighth-grade math worksheet, learners will then get to practice constructing two-way frequency tables given written descriptions of real-world data.
Eighth Grade
Data and Graphing
Interactive Worksheet
Pick a Flower Pictograph
Worksheet
Pick a Flower Pictograph
Second Grade
Data and Graphing
Find out exactly how many flowers Stefanie has planted with this pictograph for kids. Your child will learn how to analyze and interpret data.
Worksheet
Pick a Flower Pictograph
Worksheet
Pick a Flower Pictograph
Find out exactly how many flowers Stefanie has planted with this pictograph for kids. Your child will learn how to analyze and interpret data.
Second Grade
Data and Graphing
Worksheet
Reading Pictographs: Building a New Town
Worksheet
Reading Pictographs: Building a New Town
Third Grade
Data and Graphing
In this 3rd grade math worksheet, kids practice interpreting graph data and using information in a pictograph to answer word problems.
Worksheet
Reading Pictographs: Building a New Town
Worksheet
Reading Pictographs: Building a New Town
In this 3rd grade math worksheet, kids practice interpreting graph data and using information in a pictograph to answer word problems.
Third Grade
Data and Graphing
Worksheet
Graphing Proportional Relationships
Worksheet
Graphing Proportional Relationships
Eighth Grade
Ratios and Proportions
Practice graphing proportional relationships and finding the constant of proportionality with this eighth-grade math worksheet!
Worksheet
Graphing Proportional Relationships
Worksheet
Graphing Proportional Relationships
Practice graphing proportional relationships and finding the constant of proportionality with this eighth-grade math worksheet!
Eighth Grade
Ratios and Proportions
Worksheet
Write Problem Questions for Line Plots
Worksheet
Write Problem Questions for Line Plots
Third Grade
Data and Graphing
Give your students the opportunity to think critically as a mathematician. In this exercise, they will analyze a line plot and create questions about the data.
Worksheet
Write Problem Questions for Line Plots
Worksheet
Write Problem Questions for Line Plots
Give your students the opportunity to think critically as a mathematician. In this exercise, they will analyze a line plot and create questions about the data.
Third Grade
Data and Graphing
Worksheet
1
2
3
4
5
…
12