

Activity
Household Energy Consumption

Chances are, you find yourself saying it to your kids all the time: "Turn off the lights!" As energy costs rise and households continue to look for more ways to cut back, why not involve your third grader, too? Here's an activity that gives your third grader a chance to pull out her addition and multiplication skills to help your whole family take a good look at what those lights really do use up. Then, challenge your third grader to use the data to create bar graphs. What does it take to make those numbers go down?
Related learning resources

Pitch and Hit Data
Activity
Pitch and Hit Data
...So take advantage of the fresh air outdoors and your child's energy level, and start pitching, hitting, and graphing!...
3rd Grade
Math
Activity
Play Math Run
Activity
Play Math Run
...The combination of math, physical fitness and and friendly competition is perfect for burning off extra energy, sharpening math skills (especially multiplication tables...
3rd Grade
Math
Activity
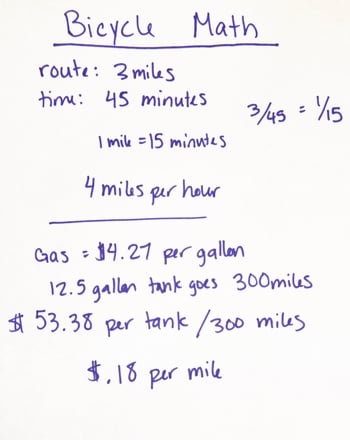
Bicycle Math
Activity
Bicycle Math
...What You Need:
Road map of your community
Ruler
Bike
Kid with helmet (and some energy to burn)
Watch with second hand (stopwatch is even better)
Pen and paper...
3rd Grade
Math
Activity
