
Activity
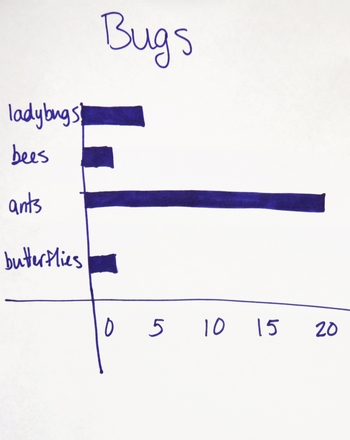
Learn to Graph with a Backyard Tournament

In first grade, students are developing their graphing skills. They’re learning how to record, organize, and show data. Of course, all of that can get a little dry. To spice it up, host a backyard tournament! Appoint your child statistician, and collecting data and showing the results on a graph will be serious fun.
Related learning resources
Weather Graph
Worksheet
Weather Graph
Observe and record the weather with your kindergartener with this cute fill-in weather graph.
1st Grade
Math
Worksheet
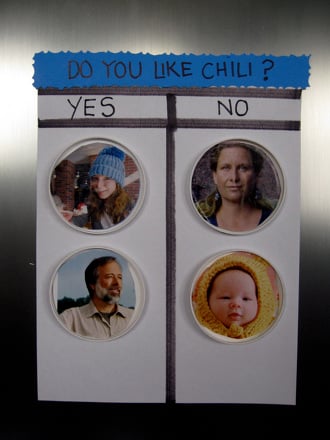
Make a Family Fridge Graph
Activity
Make a Family Fridge Graph
Make a fun refrigerator graph with your first grader in order to help her develop those crucial graphing skills, while engaging with the whole family.
1st Grade
Math
Activity
Blank Bar Graph
Worksheet
Blank Bar Graph
Get a grip on grids and graphs with this handy printable! Your math student can practice making a bar graph with this blank axis and grid.
1st Grade
Math
Worksheet