
Activity
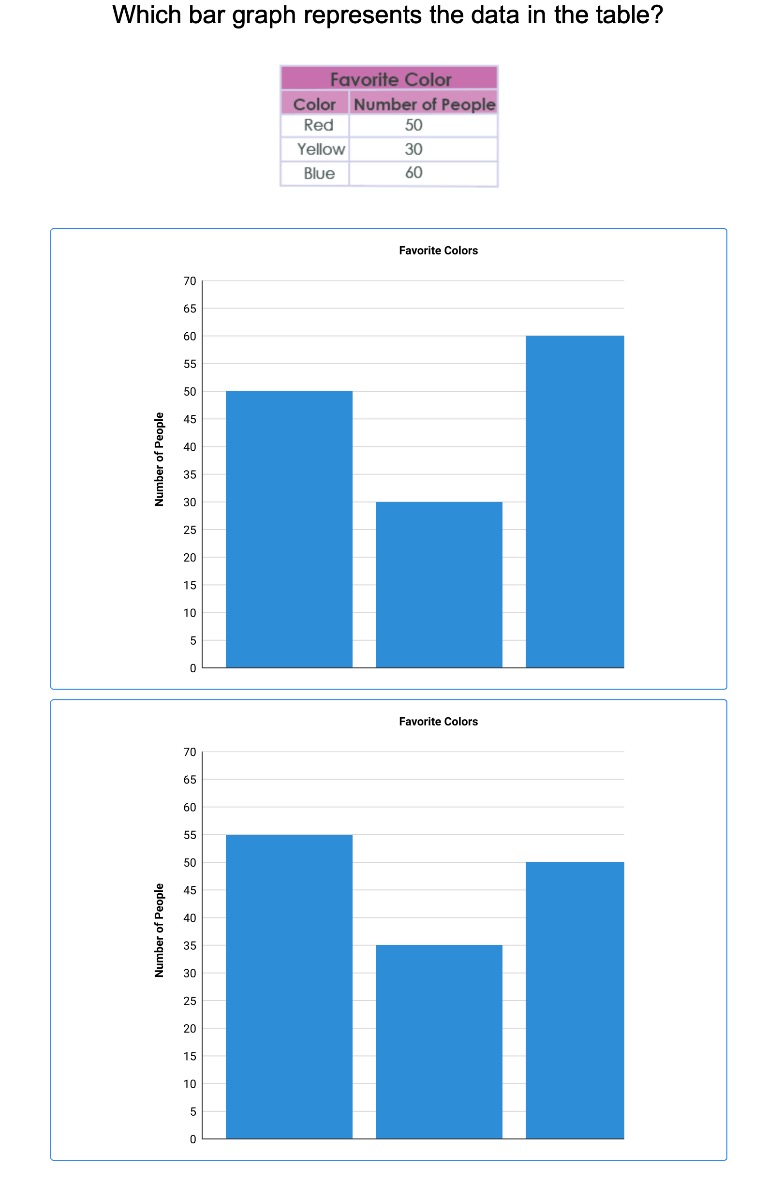
Draw a Birthday Bar Graph

Liven up a graphing exercise by helping your child graph data he's actually collected himself. He'll surprise teachers and classmates with a graphing lesson compiled from classmates' birthdays. Or, he can poll friends and family to make an at-home birthday chart. Either way, he'll be improving his graphing skills and ability to organize information. This activity makes a perfect back to school icebreaker, and who knows—he may even end up with some extra credit!
Related learning resources
Winter Sports: Practice Reading a Bar Graph
Worksheet
Winter Sports: Practice Reading a Bar Graph
Children will practice interpreting a bar graph in this winter sports–themed math worksheet.
2nd Grade
Math
Worksheet
Eat Healthy Bar Graph
Worksheet
Eat Healthy Bar Graph
Use this relevant topic about healthy food to give your students practice reading a bar graph and answering questions about the data.
3rd Grade
Math
Worksheet
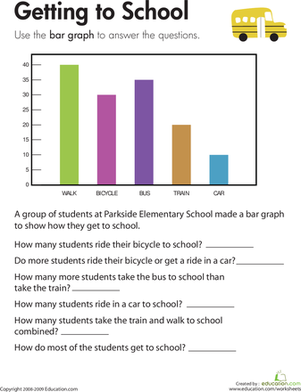
Bar Graph: Getting to School
Worksheet
Bar Graph: Getting to School
Kids completing this third grade math worksheet use a bar graph to compare data about transportation to school and solve addition and subtraction problems.
3rd Grade
Math
Worksheet