
Activity
Steepness vs. Speed: The Effect of Elevation Change on Bicycling Velocity
Grade Level: Late Middle/Early High School; Type: Earth Science/Life Science
Objective:
The point of this project is to determine exactly how much of an effect road grade has upon a cyclist’s speed and to determine if the effect follows a predictable mathematical trend.
Research Questions:
- What is slope, both mathematically and physically?
- What is the difference between speed and velocity?
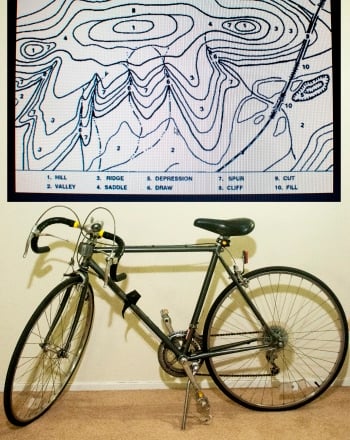
- What is topography?
- How do you read a topographic map?
- What are ‘contour lines’, and how do they show elevation on a two-dimensional map?
- What is the difference between linear and exponential growth? Linear and exponential decay?
- How do you calculate grade, in terms of road steepness?
Lance Armstrong may be the singular force that popularized professional cycling in the US. As he consistently garnered title after title in the Tour de France, Americans became interested in the sport, and our roadways began to flood with all breeds of cyclist.
As the sport gains popularity, more and more attention is being paid to the technical details; bikes are becoming lighter, gearing equipment is becoming more and more refined and tires change style every year- all in the name of shaving off seconds and remaining competitive.
All of this technical detail belies one simple truth- the real problem with speed is the fact that hills are hard to ride up. The question still remains- how hard are they to ride up? More to the point, is there a predictable mathematical pattern in speed vs. slope?
Materials:
-
A bicycle
-
Topographic maps of your area
-
A length of string and a ruler
Experimental Procedure:
The first part of this project- selecting which segments of roadway to use- is the real work of this project, and it takes some math, map reading, and instinct in equal measure. Let us outline a procedure for this portion alone, before going out and collecting data. Before we even do that, here’s something you need to know: you have to consider all of these aspects simultaneously while figuring out how best to move forward. Bear in mind, the procedures outlined below are, at best, suggestions. You will need to translate them to fit your needs.
- Find several topographic maps of your area. You are looking for both information on elevation, and readability- you will need a decent map scale to calculate distance.
- Check the map scale. Calculate one mile. Cut a length of string to the equivalent of one mile (i.e. if 1 inch=1 mile, cut off one inch of string)
- Now it’s time to start examining the map. You will need several roads that ONLY GO UPHILL, for at least a mile. Use the contour lines to make sure that this is so.
- Uphill roads are often windy. You will need the piece of string to press to the map if this is so- you need an accurate representation of the road length. Chose your road, press the string to the map directly on the road, and mark the starting and finishing points.
- Chose several more roads- with varying elevation changes- and mark them on your map.
- Calculate the rise/run of your chosen routes. Enter them in a data table, leaving a column for time. If you’ve done everything correctly, your ‘run’ should be one mile each time.
- Ride one of your routes every day, at the same time of day. Record the time it takes you to do it, and enter this in your data table.
- Graph your data as a function of slope vs. time, using a line graph.
- Examine your graph. Is it a linear function or an exponential function?
- Draw a conclusion- why did you see the results you did? This is the time to say what you think about your data.
Terms/Concepts: Speed; Velocity; Road grade; Topography; Contour lines; Contour interval; Linear relationship; Exponential relationship; Map scale
References:
A topographic map of San Francisco: http://www.topozone.com/map.asp?lat=37.775&lon=-122.41833
Education.com provides the Science Fair Project Ideas for informational purposes only. Education.com does not make any guarantee or representation regarding the Science Fair Project Ideas and is not responsible or liable for any loss or damage, directly or indirectly, caused by your use of such information. By accessing the Science Fair Project Ideas, you waive and renounce any claims against Education.com that arise thereof. In addition, your access to Education.com's website and Science Fair Project Ideas is covered by Education.com's Privacy Policy and site Terms of Use, which include limitations on Education.com's liability.
Warning is hereby given that not all Project Ideas are appropriate for all individuals or in all circumstances. Implementation of any Science Project Idea should be undertaken only in appropriate settings and with appropriate parental or other supervision. Reading and following the safety precautions of all materials used in a project is the sole responsibility of each individual. For further information, consult your state's handbook of Science Safety.
Related learning resources