6.SP.A.3 Worksheets
CCSS.MATH.CONTENT.6.SP.A.3
:"Recognize that a measure of center for a numerical data set summarizes all of its values with a single number, while a measure of variation describes how its values vary with a single number."
These worksheets can help students practice this Common Core State Standards skill.
Worksheets

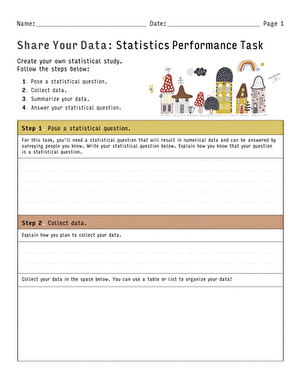
Share Your Data: Statistics Performance Task
Worksheet
Share Your Data: Statistics Performance Task
Create your own statistical study with this open-ended math worksheet for sixth graders!
6th Grade
Math
Worksheet

Describing Data Using Mean, Median, Mode, and Range
Worksheet
Describing Data Using Mean, Median, Mode, and Range
Students describe data using measures of center and a measure of variability in this statistics worksheet for middle grades!
Worksheet

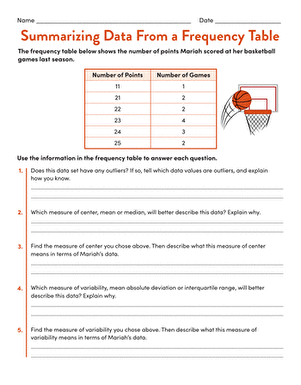
Summarizing Data From a Frequency Table
Worksheet
Summarizing Data From a Frequency Table
Practice summarizing a numerical data set with this one-page statistics worksheet!
6th Grade
Math
Worksheet

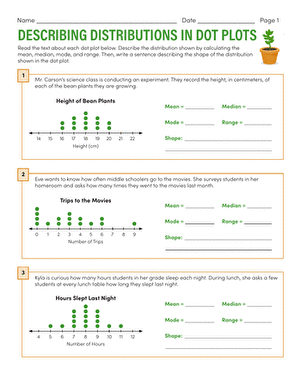
Describing Distributions in Dot Plots
Worksheet
Describing Distributions in Dot Plots
Students explore distributions in dot plots with this sixth-grade statistics worksheet!
6th Grade
Math
Worksheet

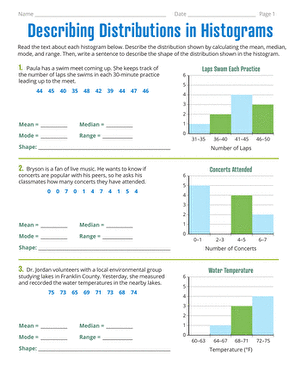
Describing Distributions in Histograms
Worksheet
Describing Distributions in Histograms
Help students deepen their understanding of histograms with this this two-page data and graphing worksheet!
6th Grade
Math
Worksheet


