SKIP TO CONTENT
Worksheet Generator
Subjects
Grades
Worksheets
Games
Build a Worksheet
More Resources
Roly Recommends
Summer Boost
Subjects
Grades
Worksheets
Games
Build a Worksheet
More Resources
Roly Recommends
Summer Boost
Showing Results for axis : Page 5
Filters
129 results
Search for: axis
✕
Clear all
129 results
Filters
Search for: axis
✕
Subjects
Math
English Language Arts
Science
Social Studies
Technology
Grade Level
Pre-K
K
1st
2nd
3rd
4th
5th
6th
7th
8th
Early Childhood
Elementary School
Middle School
Resource Type
Worksheets
Games
Lesson Plans
Activities
Offline Games
Teacher Resources
Occasion
Birthdays
St. Patrick's Day
Summer
Independence Day
Winter
Holidays
Hanukkah
Common Core
Yes
Game Type
Ball Games
English Language Support
Yes
Clear all
View 129 results
Showing Results for axis : Page 5
Filters
129 results
Search for: axis
✕
Clear all
129 results
Oil Spills and Wildlife: The Effect of a Surface Lipid Layer on Organism Survival Rates
Activity
Oil Spills and Wildlife: The Effect of a Surface Lipid Layer on Organism Survival Rates
Engineering and Science Inquiry
This science fair project idea models industrial oil spills and determines if they have an impact on wildlife living beneath the surface of the water.
Activity
Oil Spills and Wildlife: The Effect of a Surface Lipid Layer on Organism Survival Rates
Activity
Oil Spills and Wildlife: The Effect of a Surface Lipid Layer on Organism Survival Rates
This science fair project idea models industrial oil spills and determines if they have an impact on wildlife living beneath the surface of the water.
Engineering and Science Inquiry
Activity
Use Algebra to Find the Best-Priced Pizza!
Activity
Use Algebra to Find the Best-Priced Pizza!
Here's an activity that uses second-semester high school algebra to determine which pizza gives you the most bang for your appetite. Here's how to get started:
Activity
Use Algebra to Find the Best-Priced Pizza!
Activity
Use Algebra to Find the Best-Priced Pizza!
Here's an activity that uses second-semester high school algebra to determine which pizza gives you the most bang for your appetite. Here's how to get started:
Activity
Solar Hot Dog Cooker
Activity
Solar Hot Dog Cooker
Engineering and Science Inquiry
Kids use applied math to build and test a parabolic mirror solar hot dog cooker in this cool engineering science fair project idea for middle school.
Activity
Solar Hot Dog Cooker
Activity
Solar Hot Dog Cooker
Kids use applied math to build and test a parabolic mirror solar hot dog cooker in this cool engineering science fair project idea for middle school.
Engineering and Science Inquiry
Activity
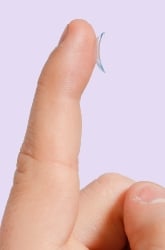
The Eyes Have It!
Activity
The Eyes Have It!
Engineering and Science Inquiry
Study structure of the lens found in the human eye and determine whether it is concave or convex. Prepare a ray diagram, formulate hypothesis.
Activity
The Eyes Have It!
Activity
The Eyes Have It!
Study structure of the lens found in the human eye and determine whether it is concave or convex. Prepare a ray diagram, formulate hypothesis.
Engineering and Science Inquiry
Activity
Bar Graphs: Interpreting Data
Lesson Plan
Bar Graphs: Interpreting Data
Second Grade
Data and Graphing
In this lesson, students will make bar graphs and interpret data using real-life data from other students. They will get practice writing and answering survey questions.
Lesson Plan
Bar Graphs: Interpreting Data
Lesson Plan
Bar Graphs: Interpreting Data
In this lesson, students will make bar graphs and interpret data using real-life data from other students. They will get practice writing and answering survey questions.
Second Grade
Data and Graphing
Lesson Plan
Apparent Movement of the Sun
Activity
Apparent Movement of the Sun
Engineering and Science Inquiry
The apparent movement of the sun has been used to keep time since the bronze age. In this science fair project, kids plot solar time against mean solar time.
Activity
Apparent Movement of the Sun
Activity
Apparent Movement of the Sun
The apparent movement of the sun has been used to keep time since the bronze age. In this science fair project, kids plot solar time against mean solar time.
Engineering and Science Inquiry
Activity
Tides in the Chesapeake Bay
Activity
Tides in the Chesapeake Bay
Engineering and Science Inquiry
Activity
Tides in the Chesapeake Bay
Activity
Tides in the Chesapeake Bay
Engineering and Science Inquiry
Activity
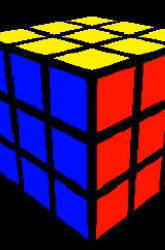
Cube It!
Activity
Cube It!
Engineering and Science Inquiry
This project involves the programming and development of a 3D Rubik's Cube application using C++.
Activity
Cube It!
Activity
Cube It!
This project involves the programming and development of a 3D Rubik's Cube application using C++.
Engineering and Science Inquiry
Activity
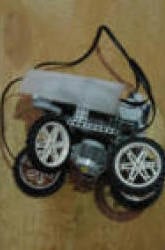
Not Cow Tipping - Car Tipping!
Activity
Not Cow Tipping - Car Tipping!
Vocabulary
The goal of this science fair project was to examine how different angles of decline affect the tipping point of a vehicle.
Activity
Not Cow Tipping - Car Tipping!
Activity
Not Cow Tipping - Car Tipping!
The goal of this science fair project was to examine how different angles of decline affect the tipping point of a vehicle.
Vocabulary
Activity
1
2
3
4
5