Box Plots Resources
7 results
Math
✕Sort by:
7 results
Sort by:
About Box Plots Resources
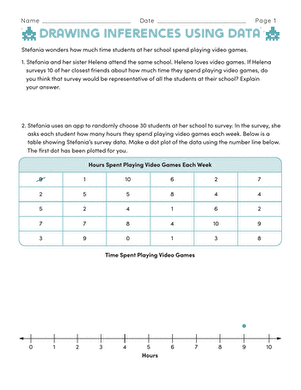
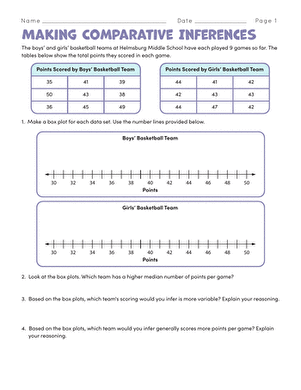
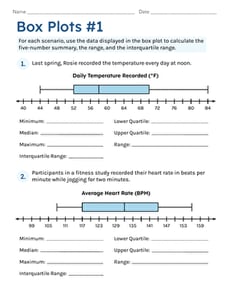
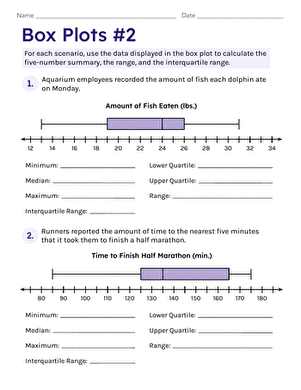
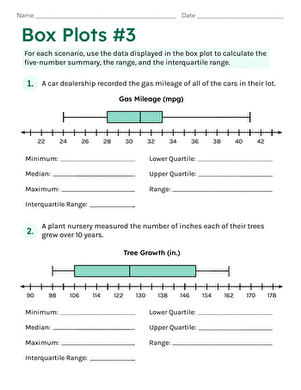
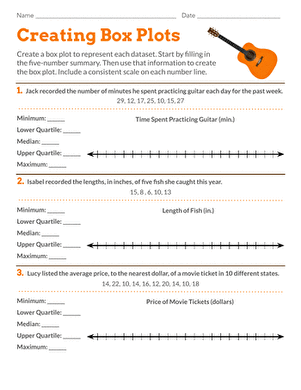
On Education.com, Box Plots Resources provide students with worksheets, printable activities, and lessons to learn about data visualization techniques. This includes understanding how to interpret, draw, and analyze box plots, which are essential tools in statistics for summarizing data sets. The materials help students develop skills in identifying medians, quartiles, and outliers while practicing data representation. This educational content supports math instruction in classroom or home settings by making concepts accessible and engaging.
Page includes comprehensive resources, such as interactive printable exercises, practice problem sets, and guided worksheets that reinforce understanding of box plot components. These materials enable educators and parents to teach statistical concepts in a structured way that builds accuracy and confidence. Additionally, resources include lesson plans and teacher guides that align with educational standards, providing structured options for instruction and practice.
Educators and parents can use these tools to support lessons on data analysis, probability, and algebra. Students gain hands-on experience creating and reading box plots, enhancing their ability to use data in real-world contexts. The materials encourage exploration, critical thinking, and problem-solving through fun, structured learning activities.

