SKIP TO CONTENT
Worksheet Generator
Subjects
Grades
Worksheets
Games
Build a Worksheet
More Resources
Roly Recommends
Subjects
Grades
Worksheets
Games
Build a Worksheet
More Resources
Roly Recommends
All Subjects
Math
Data and Graphing
Subtopics:
Collecting and Organizing Data
Picture Graphs
Bar Graphs
Line Plots
Coordinate Plane
Show Less
Filters
Search for: graphing, data
✕
Math
✕
2nd - 5th Grade
✕
Common Core
✕
Subjects
Math
English Language Arts
Science
Social Studies
Grade Level
Pre-K
K
1st
2nd
3rd
4th
5th
6th
7th
8th
Early Childhood
Elementary School
Middle School
Resource Type
Worksheets
Games
Lesson Plans
Interactive Worksheets
Workbooks
Activities
Exercises
Teacher Resources
Occasion
Summer
Back to School
Halloween
Holidays
Valentine's Day
Common Core
Yes
English Language Support
Yes
See More
Clear All
View 103 results
Showing Results for graphing data : Page 4
103 results
Search for: graphing, data
✕
Math
✕
2nd - 5th Grade
✕
Common Core
✕
Clear All
Sort by:
Relevance
Most recent
Most popular
Alphabetical A-Z
Alphabetical Z-A
All filters
103 results
Sort by:
Relevance
Most recent
Most popular
Alphabetical A-Z
Alphabetical Z-A
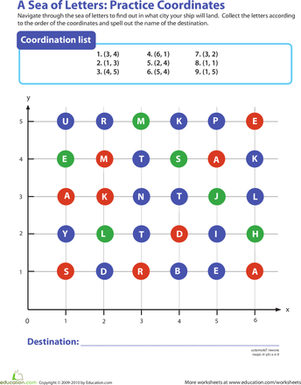
Coordinate Grid: A Sea of Letters
Worksheet
Coordinate Grid: A Sea of Letters
Fifth Grade
Geometry
Challenge your child to navigate through the sea of letters according to each coordinate to spell out a destination city's name.
Worksheet
Coordinate Grid: A Sea of Letters
Worksheet
Coordinate Grid: A Sea of Letters
Challenge your child to navigate through the sea of letters according to each coordinate to spell out a destination city's name.
Fifth Grade
Geometry
Worksheet
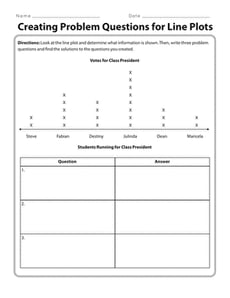
Creating Problem Questions for Line Plots
Worksheet
Creating Problem Questions for Line Plots
Third Grade
Data and Graphing
It’s time to flex your math muscles! Use this resource to have your students look at a line plot and create questions.
Worksheet
Creating Problem Questions for Line Plots
Worksheet
Creating Problem Questions for Line Plots
It’s time to flex your math muscles! Use this resource to have your students look at a line plot and create questions.
Third Grade
Data and Graphing
Worksheet
Why Do Leaves Change Color?
Activity
Why Do Leaves Change Color?
Second Grade
Data and Graphing
Engage your children with this fun fall activity that integrates math and science. First, your child will excavate to find leaves. Next, they'll examine them to determine the colors. Then, your child will graph their findings.
Activity
Why Do Leaves Change Color?
Activity
Why Do Leaves Change Color?
Engage your children with this fun fall activity that integrates math and science. First, your child will excavate to find leaves. Next, they'll examine them to determine the colors. Then, your child will graph their findings.
Second Grade
Data and Graphing
Activity
Comparing Pictographs: Football Time
Worksheet
Comparing Pictographs: Football Time
Third Grade
Data and Graphing
In this math worksheet, kids compare two pictographs that record the number of footballs kicked and the number of footballs thrown on the field.
Worksheet
Comparing Pictographs: Football Time
Worksheet
Comparing Pictographs: Football Time
In this math worksheet, kids compare two pictographs that record the number of footballs kicked and the number of footballs thrown on the field.
Third Grade
Data and Graphing
Worksheet
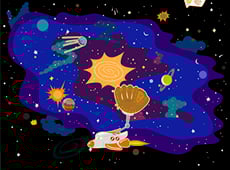
Scaled Bar Graphs in Space
Game
Scaled Bar Graphs in Space
Third Grade
Data and Graphing
Out of this world! Kids help Roly collect, sort, and graph random objects in this silly space game.
Game
Scaled Bar Graphs in Space
Game
Scaled Bar Graphs in Space
Out of this world! Kids help Roly collect, sort, and graph random objects in this silly space game.
Third Grade
Data and Graphing
Game
Graph the Critters
Worksheet
Graph the Critters
Second Grade
Data and Graphing
Give your second grader a fun way to practice basic arithmetic, and to practice making a graph with given information.
Worksheet
Graph the Critters
Worksheet
Graph the Critters
Give your second grader a fun way to practice basic arithmetic, and to practice making a graph with given information.
Second Grade
Data and Graphing
Worksheet
Introduction to Probability
Worksheet
Introduction to Probability
Fourth Grade
Data and Graphing
This bag of sports balls needs sorting! Introduce your child to probability concepts with this worksheet.
Worksheet
Introduction to Probability
Worksheet
Introduction to Probability
This bag of sports balls needs sorting! Introduce your child to probability concepts with this worksheet.
Fourth Grade
Data and Graphing
Worksheet
Flower Pie Chart
Worksheet
Flower Pie Chart
Second Grade
Data and Graphing
Even if your child isn't ready for statistics, he can learn to get his bearings around charts and graphs with this simple flower-themed pie chart worksheet.
Worksheet
Flower Pie Chart
Worksheet
Flower Pie Chart
Even if your child isn't ready for statistics, he can learn to get his bearings around charts and graphs with this simple flower-themed pie chart worksheet.
Second Grade
Data and Graphing
Worksheet
Juice Time: Practice Reading a Bar Graph
Worksheet
Juice Time: Practice Reading a Bar Graph
Third Grade
Data and Graphing
In this 3rd grade math worksheet, your child will practice reading a bar graph about juice and interpreting its information to answer a set of questions.
Worksheet
Juice Time: Practice Reading a Bar Graph
Worksheet
Juice Time: Practice Reading a Bar Graph
In this 3rd grade math worksheet, your child will practice reading a bar graph about juice and interpreting its information to answer a set of questions.
Third Grade
Data and Graphing
Worksheet
Reading Pictographs: Eggplant Cooking
Worksheet
Reading Pictographs: Eggplant Cooking
Third Grade
Data and Graphing
Mr. Chef keeps track of how many eggplants he uses with a pictograph. In this worksheet, kids use information in the pictograph to answer word problems.
Worksheet
Reading Pictographs: Eggplant Cooking
Worksheet
Reading Pictographs: Eggplant Cooking
Mr. Chef keeps track of how many eggplants he uses with a pictograph. In this worksheet, kids use information in the pictograph to answer word problems.
Third Grade
Data and Graphing
Worksheet
Favorite Cities Bar Graph
Worksheet
Favorite Cities Bar Graph
Second Grade
Data and Graphing
Can your second grader make her own bar chart? Use this pretend survey of 38 people and their favorite cities to find out!
Worksheet
Favorite Cities Bar Graph
Worksheet
Favorite Cities Bar Graph
Can your second grader make her own bar chart? Use this pretend survey of 38 people and their favorite cities to find out!
Second Grade
Data and Graphing
Worksheet
Build a Bar Graph: Favorite Wild Animals
Worksheet
Build a Bar Graph: Favorite Wild Animals
Second Grade
Data and Graphing
Analyze a bar graph with this second-grade worksheet!
Worksheet
Build a Bar Graph: Favorite Wild Animals
Worksheet
Build a Bar Graph: Favorite Wild Animals
Analyze a bar graph with this second-grade worksheet!
Second Grade
Data and Graphing
Worksheet
Mean, Median and Mode Madness!
Lesson Plan
Mean, Median and Mode Madness!
Third Grade
Data and Graphing
This lesson introduces students to the concepts of mean, median, and mode in a hands-on and visual way.
Lesson Plan
Mean, Median and Mode Madness!
Lesson Plan
Mean, Median and Mode Madness!
This lesson introduces students to the concepts of mean, median, and mode in a hands-on and visual way.
Third Grade
Data and Graphing
Lesson Plan
1
2
3
4