2nd Grade Line Plots Resources


About 2nd Grade Line Plots Resources
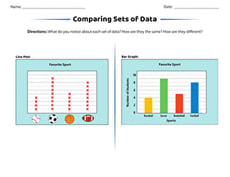
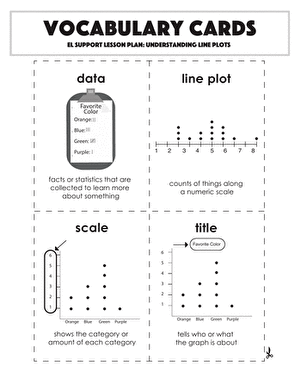
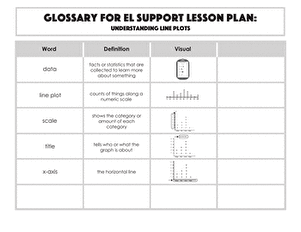
On Education.com, students can explore 2nd Grade line plots worksheets that introduce the concept of data representation. These resources help young learners practice reading and interpreting data from graphs, as well as creating their own charts. Printable activities provide real-world examples to strengthen math skills and understanding of information visualization.
This site also offers interactive tools and classroom-ready lesson plans that make engaging with line plots both fun and educational. Educators and parents can access materials that align with curriculum standards while supporting early math development and spatial reasoning. These resources provide structured practice with visual data analysis for 2nd graders.
Using these pages, teachers and parents can easily incorporate lessons on data collection, graphing, and pattern recognition into their schedules. By providing guided exercises and visual practice, this collection enhances critical thinking and numerical literacy outside the traditional classroom. These materials make learning about line plots accessible, structured, and interactive for young students.