SKIP TO CONTENT
Worksheet Generator
Subjects
Grades
Worksheets
Games
Build a Worksheet
More Resources
Roly Recommends
Subjects
Grades
Worksheets
Games
Build a Worksheet
More Resources
Roly Recommends
All Subjects
Math
Data and Graphing
Subtopics:
Collecting and Organizing Data
Picture Graphs
Bar Graphs
Line Plots
Show Less
Filters
Search for: and, elapsed, time
✕
Math
✕
3rd Grade
✕
Common Core
✕
Subjects
Math
English Language Arts
Science
Social Studies
Grade Level
Pre-K
K
1st
2nd
3rd
4th
5th
6th
7th
8th
Early Childhood
Elementary School
Middle School
Resource Type
Worksheets
Lesson Plans
Exercises
Common Core
Yes
English Language Support
Yes
See More
Clear All
View 10 results
Showing Results for and elapsed time
10 results
Search for: and, elapsed, time
✕
Math
✕
3rd Grade
✕
Common Core
✕
Clear All
Sort by:
Relevance
Most recent
Most popular
Alphabetical A-Z
Alphabetical Z-A
All filters
10 results
Sort by:
Relevance
Most recent
Most popular
Alphabetical A-Z
Alphabetical Z-A
Comparing Pictographs: Football Time
Worksheet
Comparing Pictographs: Football Time
Third Grade
Data and Graphing
In this math worksheet, kids compare two pictographs that record the number of footballs kicked and the number of footballs thrown on the field.
Worksheet
Comparing Pictographs: Football Time
Worksheet
Comparing Pictographs: Football Time
In this math worksheet, kids compare two pictographs that record the number of footballs kicked and the number of footballs thrown on the field.
Third Grade
Data and Graphing
Worksheet
Juice Time: Practice Reading a Bar Graph
Worksheet
Juice Time: Practice Reading a Bar Graph
Third Grade
Data and Graphing
In this 3rd grade math worksheet, your child will practice reading a bar graph about juice and interpreting its information to answer a set of questions.
Worksheet
Juice Time: Practice Reading a Bar Graph
Worksheet
Juice Time: Practice Reading a Bar Graph
In this 3rd grade math worksheet, your child will practice reading a bar graph about juice and interpreting its information to answer a set of questions.
Third Grade
Data and Graphing
Worksheet
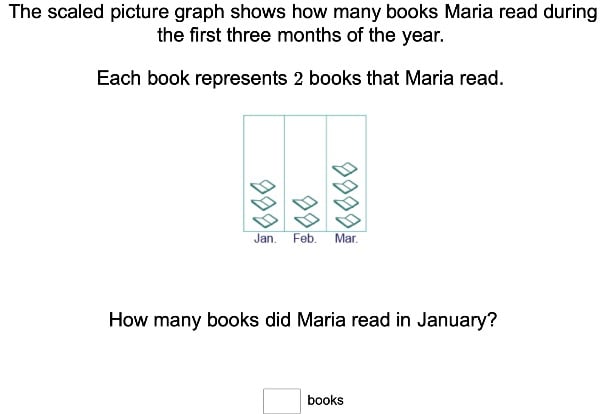
Scaled Picture Graphs
Exercise
Scaled Picture Graphs
Third Grade
Data and Graphing
For amateur mathematicians, this exercise will incorporate neat pictures into math time with scaled picture graphs.
Exercise
Scaled Picture Graphs
Exercise
Scaled Picture Graphs
For amateur mathematicians, this exercise will incorporate neat pictures into math time with scaled picture graphs.
Third Grade
Data and Graphing
Exercise
Reading a Bar Graph: Number of Athletes
Worksheet
Reading a Bar Graph: Number of Athletes
Third Grade
Data and Graphing
In this sports-themed worksheet, children use a bar graph to answer six questions about the number of athletes playing at a time in a variety of sporting events.
Worksheet
Reading a Bar Graph: Number of Athletes
Worksheet
Reading a Bar Graph: Number of Athletes
In this sports-themed worksheet, children use a bar graph to answer six questions about the number of athletes playing at a time in a variety of sporting events.
Third Grade
Data and Graphing
Worksheet
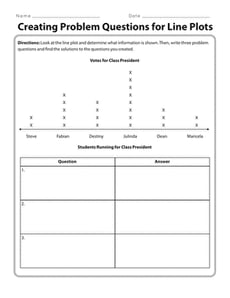
Creating Problem Questions for Line Plots
Worksheet
Creating Problem Questions for Line Plots
Third Grade
Data and Graphing
It’s time to flex your math muscles! Use this resource to have your students look at a line plot and create questions.
Worksheet
Creating Problem Questions for Line Plots
Worksheet
Creating Problem Questions for Line Plots
It’s time to flex your math muscles! Use this resource to have your students look at a line plot and create questions.
Third Grade
Data and Graphing
Worksheet
Reading Pictographs: Building a New Town
Worksheet
Reading Pictographs: Building a New Town
Third Grade
Data and Graphing
In this 3rd grade math worksheet, kids practice interpreting graph data and using information in a pictograph to answer word problems.
Worksheet
Reading Pictographs: Building a New Town
Worksheet
Reading Pictographs: Building a New Town
In this 3rd grade math worksheet, kids practice interpreting graph data and using information in a pictograph to answer word problems.
Third Grade
Data and Graphing
Worksheet
Graph Basics: Line Graphs
Worksheet
Graph Basics: Line Graphs
Third Grade
Data and Graphing
Learn how to read, analyze, and create a line graph with this helpful math worksheet!
Worksheet
Graph Basics: Line Graphs
Worksheet
Graph Basics: Line Graphs
Learn how to read, analyze, and create a line graph with this helpful math worksheet!
Third Grade
Data and Graphing
Worksheet
Let's Play Ball
Lesson Plan
Let's Play Ball
Third Grade
Multiplication
Students will have a ball with this data collection lesson plan where they learn about collecting and plotting data on a chart and line plot.
Lesson Plan
Let's Play Ball
Lesson Plan
Let's Play Ball
Students will have a ball with this data collection lesson plan where they learn about collecting and plotting data on a chart and line plot.
Third Grade
Multiplication
Lesson Plan
Mean, Median and Mode Madness!
Lesson Plan
Mean, Median and Mode Madness!
Third Grade
Data and Graphing
This lesson introduces students to the concepts of mean, median, and mode in a hands-on and visual way.
Lesson Plan
Mean, Median and Mode Madness!
Lesson Plan
Mean, Median and Mode Madness!
This lesson introduces students to the concepts of mean, median, and mode in a hands-on and visual way.
Third Grade
Data and Graphing
Lesson Plan
What is it Telling Me? Creating and Interpreting Line Plots
Lesson Plan
What is it Telling Me? Creating and Interpreting Line Plots
Third Grade
Data and Graphing
Line plots are a great way to introduce your students to graphing data. In this lesson, your students will learn how to create a line plot and also practice interpreting line plots.
Lesson Plan
What is it Telling Me? Creating and Interpreting Line Plots
Lesson Plan
What is it Telling Me? Creating and Interpreting Line Plots
Line plots are a great way to introduce your students to graphing data. In this lesson, your students will learn how to create a line plot and also practice interpreting line plots.
Third Grade
Data and Graphing
Lesson Plan
1