3rd Grade Line Plots Worksheets


About 3rd Grade Line Plots Worksheets
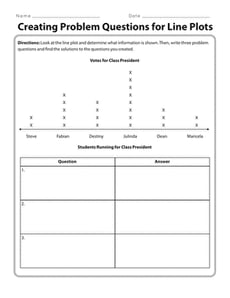
On Education.com, teaching young students how to read graphs and interpret data is an essential part of developing early math skills. The site offers a variety of 3rd grade line plots worksheets, interactive activities, and printable resources to support this learning. These materials help children understand how to organize data with scores, surveys, or counts. Educators and parents can use these resources to create engaging lessons that reinforce both graph literacy and numerical reasoning.
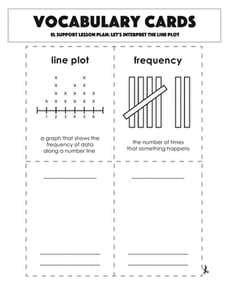
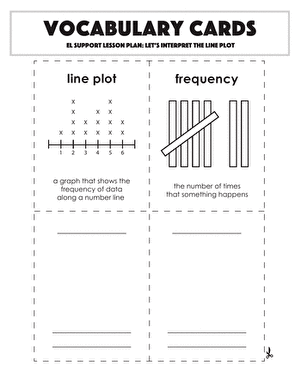
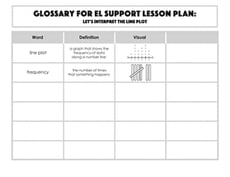
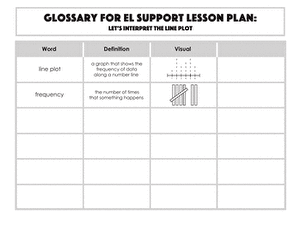
Discover content such as guides and lesson plans that introduce students to reading and creating line plots. Worksheets demonstrate how to plot points, label axes, and interpret information. These resources provide structured practice to help children develop confidence in visualizing data and recognizing patterns. Using role-based examples, the materials make learning accessible and relevant.
Browse materials designed for classroom or home learning, saving educators and parents time in planning math lessons. These consistent, structured resources build foundational skills while offering enjoyable, hands-on activities. Students gain practical experience working with data, while teachers and caregivers receive additional tools to support success.