5th Grade Data and Graphing Resources


About 5th Grade Data And Graphing Resources
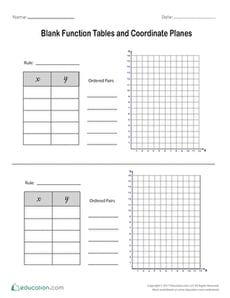
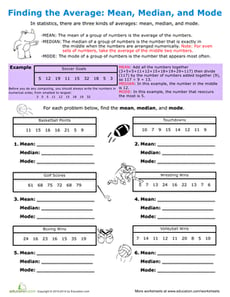
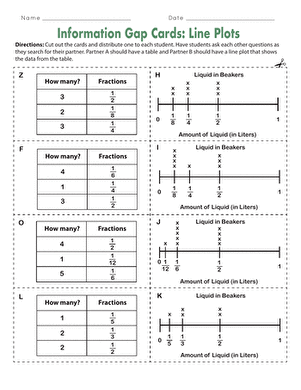
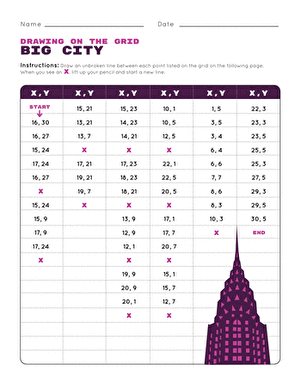
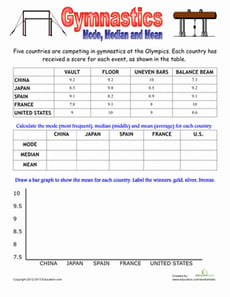
On Education.com, fifth grade data and graphing resources include printable charts, interactive worksheets, and lesson plans that teach students how to organize and display data. These materials help build foundational skills in collecting, interpreting, and presenting numerical information. Students learn to create bar graphs, line graphs, and pie charts, supporting early algebra and statistics understanding.
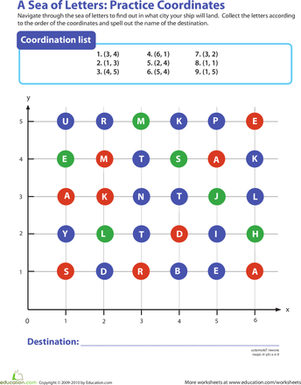
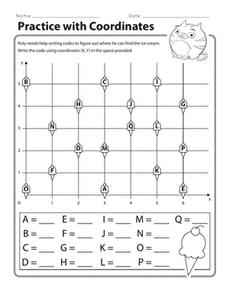
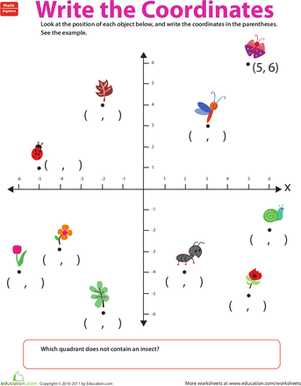
Educators and parents can access a variety of data and graphing resources such as guided practice pages, interactive activities, and project-based assignments on Education.com. These materials provide structured practice for students to explore real-world datasets in science, social studies, and math. The resources aim to foster analytical thinking, pattern recognition, and data visualization skills.
Using the page's tools, teaching professionals and caregivers can introduce students to essential graphing concepts, enhance hands-on learning, and prepare them for more advanced math and science coursework. Lesson plans and structured worksheets save time by providing ready-to-use materials that reinforce classroom instruction and at-home practice.