6th Grade Range and Mean Absolute Deviation Interactive Worksheets


About 6th Grade Range And Mean Absolute Deviation Interactive Worksheets
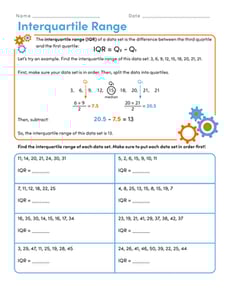
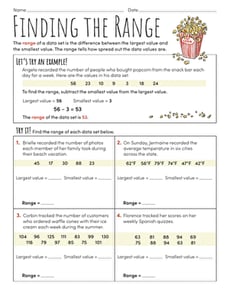
On Education.com, middle school teachers and parents can access a variety of math worksheets, including those focused on 6th grade range and mean absolute deviation. These printable materials provide practice in calculating data ranges and understanding variability, strengthening students’ statistical analysis skills. Each worksheet offers structured exercises aligned with 6th-grade learning standards to reinforce classroom concepts. Educators can incorporate these resources into lesson plans, and parents can support at-home learning while tracking progress.
Students can explore interactive worksheets and activities that showcase real-world applications of data analysis, making abstract concepts more engaging. These clear, structured exercises help learners develop critical thinking, compare data sets, and analyze variability using bend charts and spreadsheets. Such practice prepares students for more advanced mathematics, science, and data-driven decision-making. By utilizing these online resources, educators and parents provide meaningful, hands-on experience with foundational statistical topics.
Applying these materials in a classroom or at home offers a convenient way to practice calculating the 6th grade range and mean absolute deviation. The worksheets guide learners through tiered exercises that reinforce reasoning skills, accuracy, and confidence. With ready-to-use, curriculum-aligned activities, teaching involves minimal prep, ensuring more time can be dedicated to mastery and inquiry. Accessing this collection empowers learners to strengthen foundational math skills and develop a data-driven mindset.