SKIP TO CONTENT
Worksheet Generator
Subjects
Grades
Worksheets
Games
Build a Worksheet
More Resources
Roly Recommends
Reading Month
Subjects
Grades
Worksheets
Games
Build a Worksheet
More Resources
Roly Recommends
Reading Month
All Subjects
Math
Data and Graphing
Subtopics:
Collecting and Organizing Data
Picture Graphs
Bar Graphs
Show Less
Filters
Search for: three, digit
✕
Math
✕
Kindergarten - 4th Grade
✕
Subjects
Math
English Language Arts
Science
Social Studies
Foreign Language
Grade Level
Pre-K
K
1st
2nd
3rd
4th
5th
6th
7th
8th
Early Childhood
Elementary School
Middle School
Resource Type
Worksheets
Games
Lesson Plans
Interactive Worksheets
Activities
Offline Games
Guided Lessons
Occasion
Halloween
Winter
Holidays
Common Core
Yes
Arts & Crafts
Arts & Crafts
Construction & Sculpture
English Language Support
Yes
See More
Clear All
View 45 results
Showing Results for three digit : Page 2
45 results
Search for: three, digit
✕
Math
✕
Kindergarten - 4th Grade
✕
Clear All
Sort by:
Relevance
Most recent
Most popular
Alphabetical A-Z
Alphabetical Z-A
All filters
45 results
Sort by:
Relevance
Most recent
Most popular
Alphabetical A-Z
Alphabetical Z-A
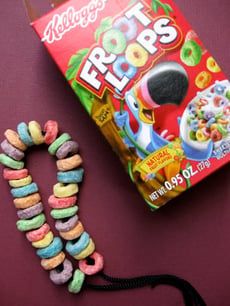
Make an Edible Fruitloop Bracelet
Activity
Make an Edible Fruitloop Bracelet
Kindergarten
Data and Graphing
Make an edible bracelet from Froot Loops and a shoelace! This Block Institute art activity will engage your special needs or mainstream child at snacktime.
Activity
Make an Edible Fruitloop Bracelet
Activity
Make an Edible Fruitloop Bracelet
Make an edible bracelet from Froot Loops and a shoelace! This Block Institute art activity will engage your special needs or mainstream child at snacktime.
Kindergarten
Data and Graphing
Activity
Track the Weather with Weather Charts
Activity
Track the Weather with Weather Charts
Third Grade
Measurement
Learn about the microclimate of your backyard by tracking rainfall, temperature, and observed weather with hand drawn charts and graphs.
Activity
Track the Weather with Weather Charts
Activity
Track the Weather with Weather Charts
Learn about the microclimate of your backyard by tracking rainfall, temperature, and observed weather with hand drawn charts and graphs.
Third Grade
Measurement
Activity
Nuts and Bolts: A Sorting Activity
Activity
Nuts and Bolts: A Sorting Activity
Kindergarten
Data and Graphing
Sorting objects by size, color, shape, or function is an important concept in kindergarten math, and it's the perfect excuse for a little housekeeping!
Activity
Nuts and Bolts: A Sorting Activity
Activity
Nuts and Bolts: A Sorting Activity
Sorting objects by size, color, shape, or function is an important concept in kindergarten math, and it's the perfect excuse for a little housekeeping!
Kindergarten
Data and Graphing
Activity
Study of Names
Activity
Study of Names
Third Grade
Data and Graphing
Graph are a great way to organize information. Your child will get to practice graphing by creating a bar graph and a pictorial graph of her friend's names.
Activity
Study of Names
Activity
Study of Names
Graph are a great way to organize information. Your child will get to practice graphing by creating a bar graph and a pictorial graph of her friend's names.
Third Grade
Data and Graphing
Activity
Make Math Fun with Buttons!
Activity
Make Math Fun with Buttons!
Kindergarten
Place Value
Have a lot of loose buttons lying around the house? Here are four ways to turn those loose buttons into an easy and positive learning experience. Button up!
Activity
Make Math Fun with Buttons!
Activity
Make Math Fun with Buttons!
Have a lot of loose buttons lying around the house? Here are four ways to turn those loose buttons into an easy and positive learning experience. Button up!
Kindergarten
Place Value
Activity
Candy Counter
Activity
Candy Counter
First Grade
Numbers and Counting
Does your kid have a stash of sweets left over from Halloween? Turn that pile of candy into a learning opportunity with this sorting and categorizing activity.
Activity
Candy Counter
Activity
Candy Counter
Does your kid have a stash of sweets left over from Halloween? Turn that pile of candy into a learning opportunity with this sorting and categorizing activity.
First Grade
Numbers and Counting
Activity
Probability Game
Activity
Probability Game
Third Grade
Data and Graphing
Probability can be a tough concept to master. Try playing this fun card game in order to help your third grader understand it a little better.
Activity
Probability Game
Activity
Probability Game
Probability can be a tough concept to master. Try playing this fun card game in order to help your third grader understand it a little better.
Third Grade
Data and Graphing
Activity
Graphing Colored Counters
Lesson Plan
Graphing Colored Counters
Kindergarten
Data and Graphing
In this lesson, your students will use the background knowledge that they have about counting and sorting to graph data. They will practice answering questions about the graph!
Lesson Plan
Graphing Colored Counters
Lesson Plan
Graphing Colored Counters
In this lesson, your students will use the background knowledge that they have about counting and sorting to graph data. They will practice answering questions about the graph!
Kindergarten
Data and Graphing
Lesson Plan
Create a Gumdrop Topiary
Activity
Create a Gumdrop Topiary
Kindergarten
Place Value
Here's a fun math-oriented arts and crafts activity for your preschool or kindergarten child: create a gumdrop topiary and practice counting along the way.
Activity
Create a Gumdrop Topiary
Activity
Create a Gumdrop Topiary
Here's a fun math-oriented arts and crafts activity for your preschool or kindergarten child: create a gumdrop topiary and practice counting along the way.
Kindergarten
Place Value
Activity
What is it Telling Me? Creating and Interpreting Line Plots
Lesson Plan
What is it Telling Me? Creating and Interpreting Line Plots
Third Grade
Data and Graphing
Line plots are a great way to introduce your students to graphing data. In this lesson, your students will learn how to create a line plot and also practice interpreting line plots.
Lesson Plan
What is it Telling Me? Creating and Interpreting Line Plots
Lesson Plan
What is it Telling Me? Creating and Interpreting Line Plots
Line plots are a great way to introduce your students to graphing data. In this lesson, your students will learn how to create a line plot and also practice interpreting line plots.
Third Grade
Data and Graphing
Lesson Plan
Chalk it Up! An Outdoor Classification Activity
Activity
Chalk it Up! An Outdoor Classification Activity
First Grade
Place Value
Get your child math and science savvy with this fun outdoor classification game. Using chalk, your child will classify what she sees in the natural world.
Activity
Chalk it Up! An Outdoor Classification Activity
Activity
Chalk it Up! An Outdoor Classification Activity
Get your child math and science savvy with this fun outdoor classification game. Using chalk, your child will classify what she sees in the natural world.
First Grade
Place Value
Activity
Create a Family Graph!
Activity
Create a Family Graph!
Third Grade
Data and Graphing
Create a graph based on the interests of family member's to see who has what in common. Your child will practice her math skills and get to know the family!
Activity
Create a Family Graph!
Activity
Create a Family Graph!
Create a graph based on the interests of family member's to see who has what in common. Your child will practice her math skills and get to know the family!
Third Grade
Data and Graphing
Activity
Nature Counting
Lesson Plan
Nature Counting
Kindergarten
Data and Graphing
Use this fun lesson plan to introduce or review the concept of addition to your ELs. Can be used as a stand alone or support lesson for the
Nature and Counting It All Adds Up
lesson plan.
Lesson Plan
Nature Counting
Lesson Plan
Nature Counting
Use this fun lesson plan to introduce or review the concept of addition to your ELs. Can be used as a stand alone or support lesson for the
Nature and Counting It All Adds Up
lesson plan.
Kindergarten
Data and Graphing
Lesson Plan
Math + Love = Valentine's Day Bar Graph
Lesson Plan
Math + Love = Valentine's Day Bar Graph
Second Grade
Data and Graphing
What's more romantic than a bar graph on Valentine's Day? In this Valentine's Day lesson plan, students will use information from a data set to create their own tally charts and bar graphs and then analyze these graphs to answer questions.
Lesson Plan
Math + Love = Valentine's Day Bar Graph
Lesson Plan
Math + Love = Valentine's Day Bar Graph
What's more romantic than a bar graph on Valentine's Day? In this Valentine's Day lesson plan, students will use information from a data set to create their own tally charts and bar graphs and then analyze these graphs to answer questions.
Second Grade
Data and Graphing
Lesson Plan
Mean, Median and Mode Madness!
Lesson Plan
Mean, Median and Mode Madness!
Third Grade
Data and Graphing
This lesson introduces students to the concepts of mean, median, and mode in a hands-on and visual way.
Lesson Plan
Mean, Median and Mode Madness!
Lesson Plan
Mean, Median and Mode Madness!
This lesson introduces students to the concepts of mean, median, and mode in a hands-on and visual way.
Third Grade
Data and Graphing
Lesson Plan
1
2