6th Grade Box Plots Resources
About 6th Grade Box Plots Resources
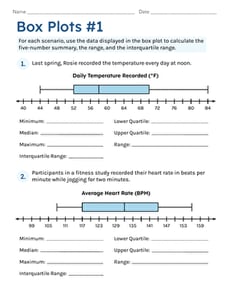
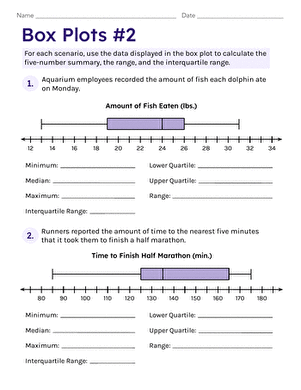
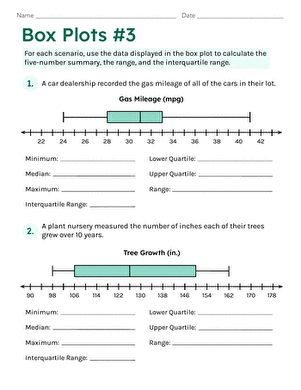
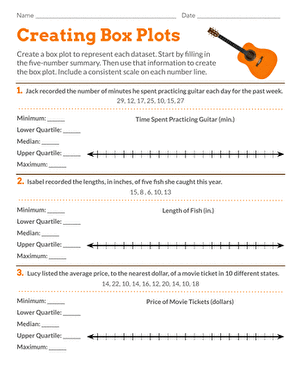
On Education.com, 6th grade box plots resources provide students with worksheets that help them understand and interpret box plots, a fundamental data visualization tool in mathematics. These materials introduce concepts such as median, quartiles, minimum, maximum, and outliers through guided practice and real-world examples. By offering printables and interactive exercises, educators can build students' skills in analyzing data distributions and reading graphs accurately.
Explore a variety of pages on Education.com that feature comprehensive lesson plans, printable worksheets, and activities focused on creating and interpreting box plots. These resources provide structured exercises that reinforce core statistical concepts and support curriculum standards for middle-grade math. Educators and parents can access structured progressions from basic to advanced exercises to ensure mastery of key skills.
By integrating these box plots resources into lessons, parents and teachers can save time while encouraging hands-on learning. The materials provide ready-made practice activities, assessments, and step-by-step guides that make statistical analysis accessible and engaging. Students gain confidence in working with data by applying visual learning strategies and interpreting real-world information with precision.


