SKIP TO CONTENT
Worksheet Generator
Subjects
Grades
Worksheets
Games
Build a Worksheet
More Resources
Roly Recommends
Summer Boost
Subjects
Grades
Worksheets
Games
Build a Worksheet
More Resources
Roly Recommends
Summer Boost
Data and Graphing Resources : Page 2
Filters
Math
Data and Graphing
662 results
Math
✕
Clear all
662 results
Subtopics:
Collecting and Organizing Data
Picture Graphs
Bar Graphs
Line Plots
Coordinate Plane
Box Plots
Histograms
Scatter Plots
Show Less
Filters
Math
✕
Subjects
Math
English Language Arts
Science
Social Studies
Foreign Language
Grade Level
Pre-K
K
1st
2nd
3rd
4th
5th
6th
7th
8th
Early Childhood
Elementary School
Middle School
Resource Type
Worksheets
Games
Lesson Plans
Interactive Worksheets
Workbooks
Activities
Exercises
Stories
Songs
Offline Games
Guided Lessons
Teacher Resources
Occasion
Birthdays
St. Patrick's Day
Easter
Earth Day
Summer
Independence Day
Back to School
Fall
Halloween
Winter
Holidays
Thanksgiving
Christmas
Hanukkah
Lunar New Year
Valentine's Day
Common Core
Yes
Game Type
Mazes
Ball Games
Printable Board Games
Travel Games
Arts & Crafts
Arts & Crafts
Paper & Glue Crafts
Construction & Sculpture
Painting & Drawing
Recycled Crafts
Coloring
Yes
English Language Support
Yes
Clear all
View 662 results
Data and Graphing Resources : Page 2
Filters
662 results
Math
✕
Clear all
662 results
Data and Graphing
Workbook
Data and Graphing
Third Grade
Data and Graphing
Become a master of analysis! In this series, kids practice collecting, creating and plotting data on graphs. Then they'll practice reading graphs, making predictions, and comparing data.
Workbook
Data and Graphing
Workbook
Data and Graphing
Become a master of analysis! In this series, kids practice collecting, creating and plotting data on graphs. Then they'll practice reading graphs, making predictions, and comparing data.
Third Grade
Data and Graphing
Workbook
Practice Test: Bar Graphs and Pictograms
Worksheet
Practice Test: Bar Graphs and Pictograms
First Grade
Data and Graphing
Help your first grader review simple graphs with this nifty printable practice quiz.
Worksheet
Practice Test: Bar Graphs and Pictograms
Worksheet
Practice Test: Bar Graphs and Pictograms
Help your first grader review simple graphs with this nifty printable practice quiz.
First Grade
Data and Graphing
Worksheet
Make Predictions Using Theoretical Probability
Interactive Worksheet
Make Predictions Using Theoretical Probability
Seventh Grade
Data and Graphing
In this seventh-grade probability worksheet, students will practice finding the theoretical probabilities for different events and using those to make predictions.
Interactive Worksheet
Make Predictions Using Theoretical Probability
Interactive Worksheet
Make Predictions Using Theoretical Probability
In this seventh-grade probability worksheet, students will practice finding the theoretical probabilities for different events and using those to make predictions.
Seventh Grade
Data and Graphing
Interactive Worksheet
Sample Spaces of Compound Events
Worksheet
Sample Spaces of Compound Events
Seventh Grade
Data and Graphing
This seventh-grade math worksheet guides students through the process of finding the sample space of compound events.
Worksheet
Sample Spaces of Compound Events
Worksheet
Sample Spaces of Compound Events
This seventh-grade math worksheet guides students through the process of finding the sample space of compound events.
Seventh Grade
Data and Graphing
Worksheet
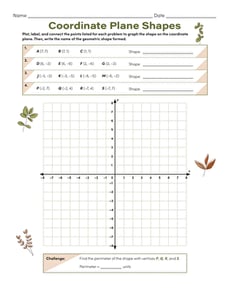
Coordinate Plane Shapes
Worksheet
Coordinate Plane Shapes
Sixth Grade
Data and Graphing
Give your students practice drawing polygons on the coordinate plane using given coordinates for the vertices with this sixth-grade geometry worksheet!
Worksheet
Coordinate Plane Shapes
Worksheet
Coordinate Plane Shapes
Give your students practice drawing polygons on the coordinate plane using given coordinates for the vertices with this sixth-grade geometry worksheet!
Sixth Grade
Data and Graphing
Worksheet
Picture Graphs: What's Your Favorite Ice Cream?
Worksheet
Picture Graphs: What's Your Favorite Ice Cream?
First Grade
Data and Graphing
Vanilla, chocolate, strawberry, or chocolate chip? Sweeten up graph practice with this simple picture graph!
Worksheet
Picture Graphs: What's Your Favorite Ice Cream?
Worksheet
Picture Graphs: What's Your Favorite Ice Cream?
Vanilla, chocolate, strawberry, or chocolate chip? Sweeten up graph practice with this simple picture graph!
First Grade
Data and Graphing
Worksheet
Translations on the Coordinate Plane
Worksheet
Translations on the Coordinate Plane
Eighth Grade
Geometry
In this eighth-grade geometry worksheet, students practice graphing images of figures after completing translations on a coordinate plane.
Worksheet
Translations on the Coordinate Plane
Worksheet
Translations on the Coordinate Plane
In this eighth-grade geometry worksheet, students practice graphing images of figures after completing translations on a coordinate plane.
Eighth Grade
Geometry
Worksheet
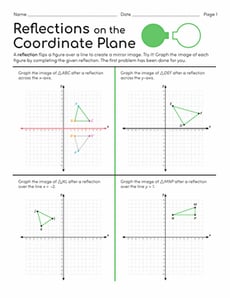
Reflections on the Coordinate Plane
Worksheet
Reflections on the Coordinate Plane
Eighth Grade
Geometry
This eighth-grade geometry worksheet gives students practice graphing images of figures after completing given reflections on coordinate planes.
Worksheet
Reflections on the Coordinate Plane
Worksheet
Reflections on the Coordinate Plane
This eighth-grade geometry worksheet gives students practice graphing images of figures after completing given reflections on coordinate planes.
Eighth Grade
Geometry
Worksheet
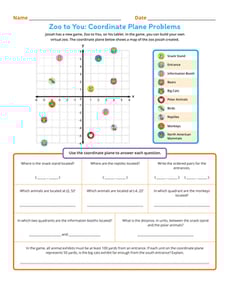
Zoo to You: Coordinate Plane Problems
Worksheet
Zoo to You: Coordinate Plane Problems
Sixth Grade
Geometry
Learners solve real-world problems on the coordinate plane as they write ordered pairs, identify the quadrants, and find the distance between two points!
Worksheet
Zoo to You: Coordinate Plane Problems
Worksheet
Zoo to You: Coordinate Plane Problems
Learners solve real-world problems on the coordinate plane as they write ordered pairs, identify the quadrants, and find the distance between two points!
Sixth Grade
Geometry
Worksheet
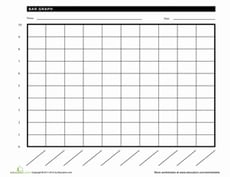
Blank Bar Graph
Worksheet
Blank Bar Graph
First Grade
Data and Graphing
Get a grip on grids and graphs with this handy printable! Your math student can practice making a bar graph with this blank axis and grid.
Worksheet
Blank Bar Graph
Worksheet
Blank Bar Graph
Get a grip on grids and graphs with this handy printable! Your math student can practice making a bar graph with this blank axis and grid.
First Grade
Data and Graphing
Worksheet
Drawing Inferences Using Data
Worksheet
Drawing Inferences Using Data
Seventh Grade
Data and Graphing
Students compare different survey methods to make inferences about how much time students at a school spend playing video games in this seventh-grade math worksheet.
Worksheet
Drawing Inferences Using Data
Worksheet
Drawing Inferences Using Data
Students compare different survey methods to make inferences about how much time students at a school spend playing video games in this seventh-grade math worksheet.
Seventh Grade
Data and Graphing
Worksheet
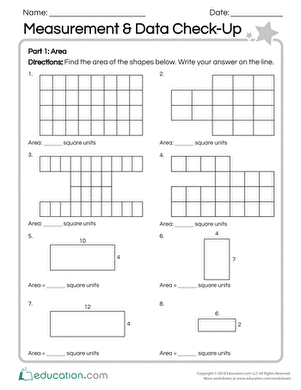
Measurement & Data Check-Up
Worksheet
Measurement & Data Check-Up
Third Grade
Geometry
Use this resource to assess your students’ mastery of concepts surrounding measurement and data.
Worksheet
Measurement & Data Check-Up
Worksheet
Measurement & Data Check-Up
Use this resource to assess your students’ mastery of concepts surrounding measurement and data.
Third Grade
Geometry
Worksheet
Coordinate Points at the Air Show
Worksheet
Coordinate Points at the Air Show
Fifth Grade
Data and Graphing
Invite your fourth grader to help some pilots find their routes by plotting sets of coordinate points on a grid!
Worksheet
Coordinate Points at the Air Show
Worksheet
Coordinate Points at the Air Show
Invite your fourth grader to help some pilots find their routes by plotting sets of coordinate points on a grid!
Fifth Grade
Data and Graphing
Worksheet
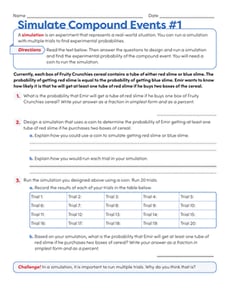
Simulate Compound Events #1
Worksheet
Simulate Compound Events #1
Seventh Grade
Data and Graphing
Practice designing a simulation for real-world compound events with this seventh-grade probability worksheet!
Worksheet
Simulate Compound Events #1
Worksheet
Simulate Compound Events #1
Practice designing a simulation for real-world compound events with this seventh-grade probability worksheet!
Seventh Grade
Data and Graphing
Worksheet
Constructing Scatter Plots
Worksheet
Constructing Scatter Plots
Eighth Grade
Data and Graphing
Get students creating scatter plots using real-world data sets with this eighth-grade math worksheet!
Worksheet
Constructing Scatter Plots
Worksheet
Constructing Scatter Plots
Get students creating scatter plots using real-world data sets with this eighth-grade math worksheet!
Eighth Grade
Data and Graphing
Worksheet
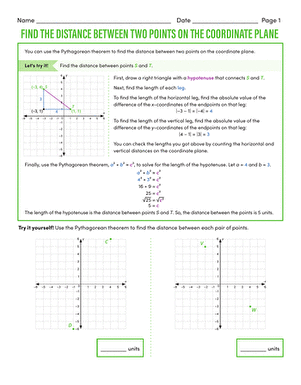
Find the Distance Between Two Points on the Coordinate Plane
Interactive Worksheet
Find the Distance Between Two Points on the Coordinate Plane
Eighth Grade
Geometry
Did you know that you can use the Pythagorean theorem to find the distance between two points on the coordinate plane? Try it out with this eighth-grade geometry worksheet!
Interactive Worksheet
Find the Distance Between Two Points on the Coordinate Plane
Interactive Worksheet
Find the Distance Between Two Points on the Coordinate Plane
Did you know that you can use the Pythagorean theorem to find the distance between two points on the coordinate plane? Try it out with this eighth-grade geometry worksheet!
Eighth Grade
Geometry
Interactive Worksheet
Mystery Picture Graph: Night Scene
Worksheet
Mystery Picture Graph: Night Scene
Fifth Grade
Geometry
Plot the coordinates on the grid to reveal a mystery picture in this two-page graphing worksheet!
Worksheet
Mystery Picture Graph: Night Scene
Worksheet
Mystery Picture Graph: Night Scene
Plot the coordinates on the grid to reveal a mystery picture in this two-page graphing worksheet!
Fifth Grade
Geometry
Worksheet
Scatter Plots
Worksheet
Scatter Plots
Eighth Grade
Data and Graphing
Students practice identifying outliers and the types of associations shown on scatter plots in this eighth-grade data and graphing worksheet!
Worksheet
Scatter Plots
Worksheet
Scatter Plots
Students practice identifying outliers and the types of associations shown on scatter plots in this eighth-grade data and graphing worksheet!
Eighth Grade
Data and Graphing
Worksheet
Line Plots and Unit Fractions
Exercise
Line Plots and Unit Fractions
Fourth Grade
Fractions
Understanding unit fractions is a lot easier with this exercise that lays out all out on line plots.
Exercise
Line Plots and Unit Fractions
Exercise
Line Plots and Unit Fractions
Understanding unit fractions is a lot easier with this exercise that lays out all out on line plots.
Fourth Grade
Fractions
Exercise
Pictographs: Say Cheese!
Worksheet
Pictographs: Say Cheese!
Third Grade
Data and Graphing
To keep track of his cheese sales, Giovanni uses a pictograph. Kids will figure out how his cheese business is doing by using data in the graph.
Worksheet
Pictographs: Say Cheese!
Worksheet
Pictographs: Say Cheese!
To keep track of his cheese sales, Giovanni uses a pictograph. Kids will figure out how his cheese business is doing by using data in the graph.
Third Grade
Data and Graphing
Worksheet
Making Comparative Inferences
Worksheet
Making Comparative Inferences
Seventh Grade
Data and Graphing
Give students practice creating box plots and making comparative inferences with this seventh-grade math worksheet!
Worksheet
Making Comparative Inferences
Worksheet
Making Comparative Inferences
Give students practice creating box plots and making comparative inferences with this seventh-grade math worksheet!
Seventh Grade
Data and Graphing
Worksheet
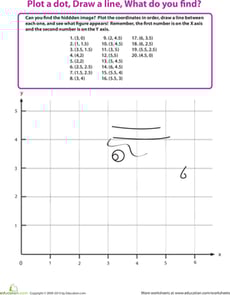
Plot the Coordinates to Draw a Picture
Worksheet
Plot the Coordinates to Draw a Picture
Fifth Grade
Data and Graphing
Your child will learn about coordinates, plot points, connect the dots, and draw a silly picture!
Worksheet
Plot the Coordinates to Draw a Picture
Worksheet
Plot the Coordinates to Draw a Picture
Your child will learn about coordinates, plot points, connect the dots, and draw a silly picture!
Fifth Grade
Data and Graphing
Worksheet
Honey Bee: Practice Coordinates
Worksheet
Honey Bee: Practice Coordinates
Fifth Grade
Data and Graphing
Working with grids and coordinates doesn't need to be dull! Invite your child to practice by helping this honey bee find his way home.
Worksheet
Honey Bee: Practice Coordinates
Worksheet
Honey Bee: Practice Coordinates
Working with grids and coordinates doesn't need to be dull! Invite your child to practice by helping this honey bee find his way home.
Fifth Grade
Data and Graphing
Worksheet
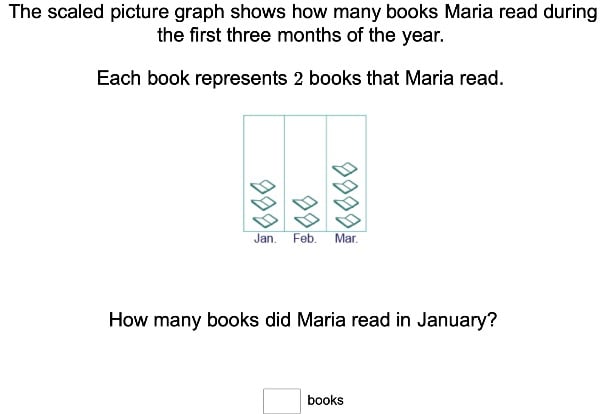
Scaled Picture Graphs
Exercise
Scaled Picture Graphs
Third Grade
Data and Graphing
For amateur mathematicians, this exercise will incorporate neat pictures into math time with scaled picture graphs.
Exercise
Scaled Picture Graphs
Exercise
Scaled Picture Graphs
For amateur mathematicians, this exercise will incorporate neat pictures into math time with scaled picture graphs.
Third Grade
Data and Graphing
Exercise
Line Plot Practice
Worksheet
Line Plot Practice
Second Grade
Data and Graphing
Use this worksheet to get your mathematicians comfortable and confident creating and interpreting line plots from a given set of data.
Worksheet
Line Plot Practice
Worksheet
Line Plot Practice
Use this worksheet to get your mathematicians comfortable and confident creating and interpreting line plots from a given set of data.
Second Grade
Data and Graphing
Worksheet
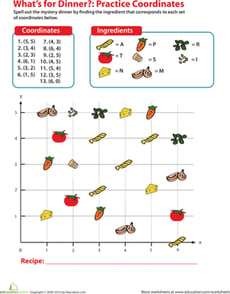
Finding Coordinates: Riddle
Worksheet
Finding Coordinates: Riddle
Fifth Grade
Data and Graphing
Your fourth grader can spell out what's for dinner and practice algebra basics by finding the ingredient that corresponds to each coordinate in the list.
Worksheet
Finding Coordinates: Riddle
Worksheet
Finding Coordinates: Riddle
Your fourth grader can spell out what's for dinner and practice algebra basics by finding the ingredient that corresponds to each coordinate in the list.
Fifth Grade
Data and Graphing
Worksheet
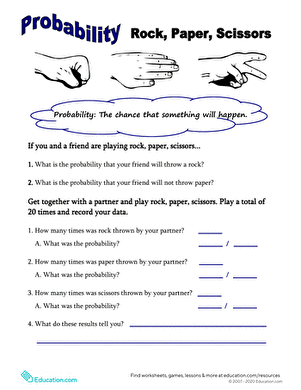
Rock, Paper, Scissors Probability
Worksheet
Rock, Paper, Scissors Probability
Fifth Grade
Data and Graphing
Rock... paper... scissors! Discover a bit more about the math behind this childhood game with this exercise in probability.
Worksheet
Rock, Paper, Scissors Probability
Worksheet
Rock, Paper, Scissors Probability
Rock... paper... scissors! Discover a bit more about the math behind this childhood game with this exercise in probability.
Fifth Grade
Data and Graphing
Worksheet
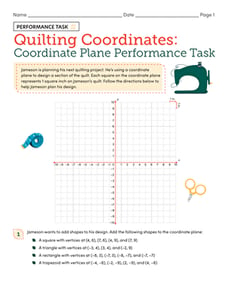
Quilting Coordinates: Coordinate Plane Performance Task
Worksheet
Quilting Coordinates: Coordinate Plane Performance Task
Sixth Grade
Geometry
Help Jameson plan his design for a quilting project in this coordinate plane performance task!
Worksheet
Quilting Coordinates: Coordinate Plane Performance Task
Worksheet
Quilting Coordinates: Coordinate Plane Performance Task
Help Jameson plan his design for a quilting project in this coordinate plane performance task!
Sixth Grade
Geometry
Worksheet
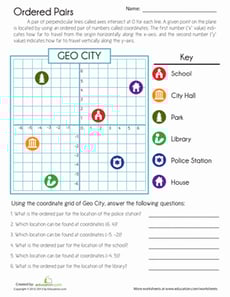
Coordinate Grid Map
Worksheet
Coordinate Grid Map
Sixth Grade
Geometry
Navigate this map of Geo City! Put those graphing skills to the test by identifying and locating ordered pairs on this coordinate grid map.
Worksheet
Coordinate Grid Map
Worksheet
Coordinate Grid Map
Navigate this map of Geo City! Put those graphing skills to the test by identifying and locating ordered pairs on this coordinate grid map.
Sixth Grade
Geometry
Worksheet
Probability Dice: Practice With Probability Models
Worksheet
Probability Dice: Practice With Probability Models
Seventh Grade
Data and Graphing
Probability can be as easy as rolling dice! What is the probability of rolling a 2? What about a 6? Practice calculating basic probability with this worksheet.
Worksheet
Probability Dice: Practice With Probability Models
Worksheet
Probability Dice: Practice With Probability Models
Probability can be as easy as rolling dice! What is the probability of rolling a 2? What about a 6? Practice calculating basic probability with this worksheet.
Seventh Grade
Data and Graphing
Worksheet
1
2
3
4
…
23