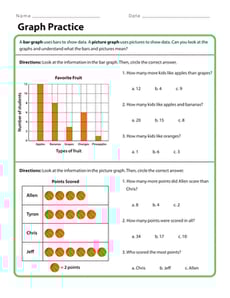
Bar Graphs Interactive Worksheets
About Bar Graphs Interactive Worksheets
On Education.com, bar graphs interactive worksheets provide children with hands-on practice in understanding data visualization by creating and analyzing bar graphs. These activities help students develop skills in interpreting information, comparing categories, and organizing data for clear presentation. The worksheets often include printable charts, graphing exercises, and guided lessons for math and science learning.
Educators and parents can access a wide range of activities that combine visuals with interactive elements to reinforce classroom lessons at home. These printable materials make it easy to integrate bar graph practice into lesson plans, provide assessment opportunities, and enhance students' data literacy - all while encouraging engagement, critical thinking, and visual analysis skills.
Using bar graphs interactive worksheets supports personalized learning by giving students step-by-step guidance in collecting and representing data. Whether for classroom projects, homework, or extra practice, parents and teachers can rely on these resources to make learning about graphs fun, accessible, and educationally effective.

