SKIP TO CONTENT
Worksheet Generator
Subjects
Grades
Worksheets
Games
Build a Worksheet
More Resources
Roly Recommends
Summer Boost
Subjects
Grades
Worksheets
Games
Build a Worksheet
More Resources
Roly Recommends
Summer Boost
Showing Results for data driven instruction : Page 12
Filters
Math
466 results
Search for: data, driven, instruction
✕
Math
✕
Clear all
466 results
Subtopics:
Addition
Subtraction
Multiplication
Division
Numbers and Counting
Patterns
Place Value
Mixed Operations
Fractions
Decimals
Exponents and Roots
Number Theory
Time and Money
Ratios and Proportions
Algebra
Geometry
Measurement
Data and Graphing
Probability
Statistics
Math Puzzles
Show Less
Filters
Search for: data, driven, instruction
✕
Math
✕
Subjects
Math
English Language Arts
Science
Social Studies
Foreign Language
Technology
Grade Level
Pre-K
K
1st
2nd
3rd
4th
5th
6th
7th
8th
Early Childhood
Elementary School
Middle School
Resource Type
Worksheets
Games
Lesson Plans
Interactive Worksheets
Workbooks
Activities
Exercises
Songs
Offline Games
Guided Lessons
Teacher Resources
See more
Occasion
Birthdays
Spring
Summer
Back to School
Fall
Halloween
Winter
Holidays
Christmas
Valentine's Day
See more
Common Core
Yes
Game Type
Dot to Dot
Ball Games
Arts & Crafts
Arts & Crafts
Paper & Glue Crafts
Coloring
Yes
English Language Support
Yes
Clear all
View 466 results
Showing Results for data driven instruction : Page 12
Filters
466 results
Search for: data, driven, instruction
✕
Math
✕
Clear all
466 results
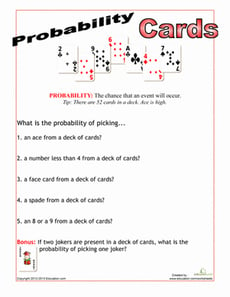
Deck of Cards Probability
Worksheet
Deck of Cards Probability
Fifth Grade
Data and Graphing
Pick a card, any card! Practice probability by exploring the various odds that can be found in a standard deck of playing cards.
Worksheet
Deck of Cards Probability
Worksheet
Deck of Cards Probability
Pick a card, any card! Practice probability by exploring the various odds that can be found in a standard deck of playing cards.
Fifth Grade
Data and Graphing
Worksheet
Ice Cream Bar Graph #10
Worksheet
Ice Cream Bar Graph #10
First Grade
Data and Graphing
Sam, Kate, and Becky need help keeping track of their ice cream sales. Practice using bar graphs, addition, and subtraction in this ice cream themed worksheet.
Worksheet
Ice Cream Bar Graph #10
Worksheet
Ice Cream Bar Graph #10
Sam, Kate, and Becky need help keeping track of their ice cream sales. Practice using bar graphs, addition, and subtraction in this ice cream themed worksheet.
First Grade
Data and Graphing
Worksheet
Ice Cream Graph #15
Worksheet
Ice Cream Graph #15
First Grade
Data and Graphing
Three kids set up an ice cream stand, but they need your child's help figuring out how much they sold. Help Sam, Kate, and Becky calculate their sales and more.
Worksheet
Ice Cream Graph #15
Worksheet
Ice Cream Graph #15
Three kids set up an ice cream stand, but they need your child's help figuring out how much they sold. Help Sam, Kate, and Becky calculate their sales and more.
First Grade
Data and Graphing
Worksheet
Ice Cream Graph #20
Worksheet
Ice Cream Graph #20
First Grade
Data and Graphing
Young entrepreneurs Sam, Kate, and Becky sold some ice cream cones, but they need help figuring out how many. Exercise pictograph skills in this worksheet.
Worksheet
Ice Cream Graph #20
Worksheet
Ice Cream Graph #20
Young entrepreneurs Sam, Kate, and Becky sold some ice cream cones, but they need help figuring out how many. Exercise pictograph skills in this worksheet.
First Grade
Data and Graphing
Worksheet
Transportation Match-Up
Worksheet
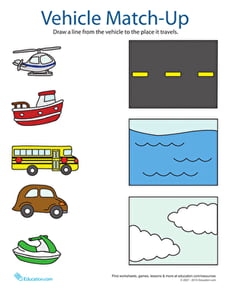
Transportation Match-Up
Kindergarten
Data and Graphing
There are many different modes of transportation. Some travel on land, some on air, and others on water! Can you tell the difference?
Worksheet
Transportation Match-Up
Worksheet
Transportation Match-Up
There are many different modes of transportation. Some travel on land, some on air, and others on water! Can you tell the difference?
Kindergarten
Data and Graphing
Worksheet
Punched-Out Shapes
Lesson Plan
Punched-Out Shapes
Pre-K
Geometry
Your students will get right to the point with this small group activity! Your students will use large push pins to punch out shapes, all while improving fine motor skills and creating class books to read when the activity is finished.
Lesson Plan
Punched-Out Shapes
Lesson Plan
Punched-Out Shapes
Your students will get right to the point with this small group activity! Your students will use large push pins to punch out shapes, all while improving fine motor skills and creating class books to read when the activity is finished.
Pre-K
Geometry
Lesson Plan
Solve Two-Step Equations Quiz
Worksheet
Solve Two-Step Equations Quiz
Seventh Grade
Algebra
Check your students’ understanding of how to solve two-step equations with this helpful quiz-style worksheet!
Worksheet
Solve Two-Step Equations Quiz
Worksheet
Solve Two-Step Equations Quiz
Check your students’ understanding of how to solve two-step equations with this helpful quiz-style worksheet!
Seventh Grade
Algebra
Worksheet
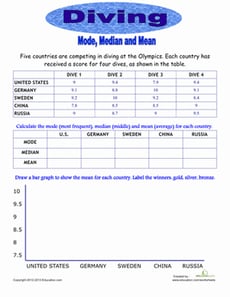
Olympic Math: Diving
Worksheet
Olympic Math: Diving
Fifth Grade
Data and Graphing
Dive into math! Five countries are competing in diving in the Olympics, and they have been scored on four dives. Find the mode, median and mean of their scores.
Worksheet
Olympic Math: Diving
Worksheet
Olympic Math: Diving
Dive into math! Five countries are competing in diving in the Olympics, and they have been scored on four dives. Find the mode, median and mean of their scores.
Fifth Grade
Data and Graphing
Worksheet
Catch a whiff of it?
Activity
Catch a whiff of it?
Measurement
Science fair project that studies how perfumes are made in order to determine how we can capture a scent.
Activity
Catch a whiff of it?
Activity
Catch a whiff of it?
Science fair project that studies how perfumes are made in order to determine how we can capture a scent.
Measurement
Activity
Measuring Sugar in Fruit Using a Refractometer
Activity
Measuring Sugar in Fruit Using a Refractometer
Measurement
This fun science fair project idea explains what a circadian rhythm is and explores the types of biological activities that follow a 24 hour cycle in mammals.
Activity
Measuring Sugar in Fruit Using a Refractometer
Activity
Measuring Sugar in Fruit Using a Refractometer
This fun science fair project idea explains what a circadian rhythm is and explores the types of biological activities that follow a 24 hour cycle in mammals.
Measurement
Activity
Heat Transfer? Can you Measure it? How is it Done?
Activity
Heat Transfer? Can you Measure it? How is it Done?
Measurement
Read on this high school science fair project idea to get basic information on the process of heat transfer and the conditions under which the transfer occurs.
Activity
Heat Transfer? Can you Measure it? How is it Done?
Activity
Heat Transfer? Can you Measure it? How is it Done?
Read on this high school science fair project idea to get basic information on the process of heat transfer and the conditions under which the transfer occurs.
Measurement
Activity
Flower Pie Chart
Worksheet
Flower Pie Chart
Second Grade
Data and Graphing
Even if your child isn't ready for statistics, he can learn to get his bearings around charts and graphs with this simple flower-themed pie chart worksheet.
Worksheet
Flower Pie Chart
Worksheet
Flower Pie Chart
Even if your child isn't ready for statistics, he can learn to get his bearings around charts and graphs with this simple flower-themed pie chart worksheet.
Second Grade
Data and Graphing
Worksheet
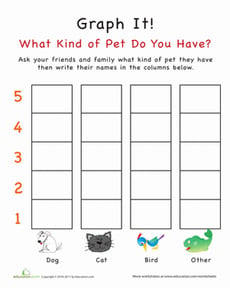
Graph It! What Kind of Pet Do You Have?
Worksheet
Graph It! What Kind of Pet Do You Have?
Kindergarten
Data and Graphing
This worksheet is perfect for the kid that asks, "When am I ever going to use math?" Conduct a pet survey with your child by using this pet graphing worksheet.
Worksheet
Graph It! What Kind of Pet Do You Have?
Worksheet
Graph It! What Kind of Pet Do You Have?
This worksheet is perfect for the kid that asks, "When am I ever going to use math?" Conduct a pet survey with your child by using this pet graphing worksheet.
Kindergarten
Data and Graphing
Worksheet
Graph It! What Color is Your Hair?
Worksheet
Graph It! What Color is Your Hair?
Kindergarten
Data and Graphing
Your child will use his math know-how in a practical situation with this Graph It! worksheet. Your child will use graphing skills to chart friends' hair colors.
Worksheet
Graph It! What Color is Your Hair?
Worksheet
Graph It! What Color is Your Hair?
Your child will use his math know-how in a practical situation with this Graph It! worksheet. Your child will use graphing skills to chart friends' hair colors.
Kindergarten
Data and Graphing
Worksheet
Juice Time: Practice Reading a Bar Graph
Worksheet
Juice Time: Practice Reading a Bar Graph
Third Grade
Data and Graphing
In this 3rd grade math worksheet, your child will practice reading a bar graph about juice and interpreting its information to answer a set of questions.
Worksheet
Juice Time: Practice Reading a Bar Graph
Worksheet
Juice Time: Practice Reading a Bar Graph
In this 3rd grade math worksheet, your child will practice reading a bar graph about juice and interpreting its information to answer a set of questions.
Third Grade
Data and Graphing
Worksheet
Tally Time: On the Farm
Worksheet
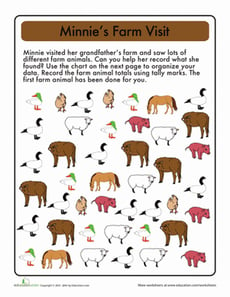
Tally Time: On the Farm
First Grade
Data and Graphing
Kids help Minnie figure out how many pigs, sheep, and other animals live on the farm by reading the tables and counting up the tally marks.
Worksheet
Tally Time: On the Farm
Worksheet
Tally Time: On the Farm
Kids help Minnie figure out how many pigs, sheep, and other animals live on the farm by reading the tables and counting up the tally marks.
First Grade
Data and Graphing
Worksheet
Plant a Flower Garden
Worksheet
Plant a Flower Garden
Kindergarten
Data and Graphing
Plant a paper flower garden with this fun sorting activity! Children color the flowers, then cut them out and sort them by type.
Worksheet
Plant a Flower Garden
Worksheet
Plant a Flower Garden
Plant a paper flower garden with this fun sorting activity! Children color the flowers, then cut them out and sort them by type.
Kindergarten
Data and Graphing
Worksheet
Backyard Bugs
Activity
Backyard Bugs
First Grade
Data and Graphing
Want to boost math and science learning? Take a bug expedition and give your first grader practice observing and charting what they see.
Activity
Backyard Bugs
Activity
Backyard Bugs
Want to boost math and science learning? Take a bug expedition and give your first grader practice observing and charting what they see.
First Grade
Data and Graphing
Activity
When Should You Add Creamer?
Activity
When Should You Add Creamer?
Measurement
Determine whether a hot liquid cools off faster when liquid is added before or after a two minute wait.
Activity
When Should You Add Creamer?
Activity
When Should You Add Creamer?
Determine whether a hot liquid cools off faster when liquid is added before or after a two minute wait.
Measurement
Activity
Which Exercise Gives Your Heart and Muscles the Best Workout?
Activity
Which Exercise Gives Your Heart and Muscles the Best Workout?
Measurement
Determine the differences between various bicep exercises, both in terms of how much muscle exertion they create and how they affect your heart rate.
Activity
Which Exercise Gives Your Heart and Muscles the Best Workout?
Activity
Which Exercise Gives Your Heart and Muscles the Best Workout?
Determine the differences between various bicep exercises, both in terms of how much muscle exertion they create and how they affect your heart rate.
Measurement
Activity
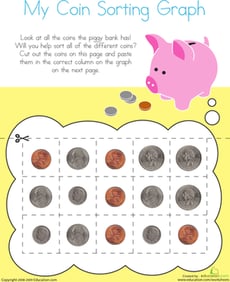
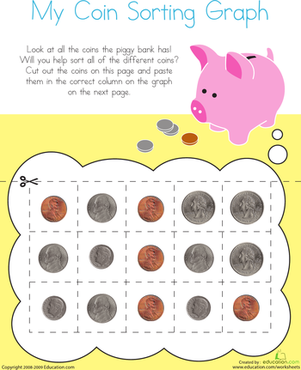
Picture Graph: Sorting Coins
Worksheet
Picture Graph: Sorting Coins
Kindergarten
Time and Money
This piggy bank has so many coins! Kids completing this kindergarten math worksheet cut out the coins, sort them, and paste them into a picture graph.
Worksheet
Picture Graph: Sorting Coins
Worksheet
Picture Graph: Sorting Coins
This piggy bank has so many coins! Kids completing this kindergarten math worksheet cut out the coins, sort them, and paste them into a picture graph.
Kindergarten
Time and Money
Worksheet
Reading Pictographs: Eggplant Cooking
Worksheet
Reading Pictographs: Eggplant Cooking
Third Grade
Data and Graphing
Mr. Chef keeps track of how many eggplants he uses with a pictograph. In this worksheet, kids use information in the pictograph to answer word problems.
Worksheet
Reading Pictographs: Eggplant Cooking
Worksheet
Reading Pictographs: Eggplant Cooking
Mr. Chef keeps track of how many eggplants he uses with a pictograph. In this worksheet, kids use information in the pictograph to answer word problems.
Third Grade
Data and Graphing
Worksheet
Favorite Cities Bar Graph
Worksheet
Favorite Cities Bar Graph
Second Grade
Data and Graphing
Can your second grader make her own bar chart? Use this pretend survey of 38 people and their favorite cities to find out!
Worksheet
Favorite Cities Bar Graph
Worksheet
Favorite Cities Bar Graph
Can your second grader make her own bar chart? Use this pretend survey of 38 people and their favorite cities to find out!
Second Grade
Data and Graphing
Worksheet
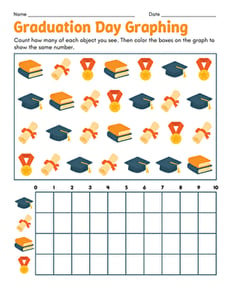
Graduation Day Graphing
Worksheet
Graduation Day Graphing
Kindergarten
Numbers and Counting
Celebrate the end of the school year with this graduation-themed counting worksheet for kindergarteners!
Worksheet
Graduation Day Graphing
Worksheet
Graduation Day Graphing
Celebrate the end of the school year with this graduation-themed counting worksheet for kindergarteners!
Kindergarten
Numbers and Counting
Worksheet
Wrinkle Removal Products
Activity
Wrinkle Removal Products
Measurement
Test products which claim to reduce wrinkles, and determine which is the most effective. Test effectiveness over three weeks, using a sample of volunteers.
Activity
Wrinkle Removal Products
Activity
Wrinkle Removal Products
Test products which claim to reduce wrinkles, and determine which is the most effective. Test effectiveness over three weeks, using a sample of volunteers.
Measurement
Activity
Linking Line Plots and Fractions
Lesson Plan
Linking Line Plots and Fractions
Fifth Grade
Fractions
Can your students link line plots with fractions? In this interactive, hands-on math lesson, students will learn how to use a line plot to add fractions and solve corresponding word problems.
Lesson Plan
Linking Line Plots and Fractions
Lesson Plan
Linking Line Plots and Fractions
Can your students link line plots with fractions? In this interactive, hands-on math lesson, students will learn how to use a line plot to add fractions and solve corresponding word problems.
Fifth Grade
Fractions
Lesson Plan
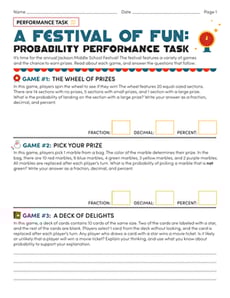
A Festival of Fun: Probability Performance Task
Worksheet
A Festival of Fun: Probability Performance Task
Seventh Grade
Data and Graphing
Students demonstrate their proficiency with probability in this three-page performance task worksheet!
Worksheet
A Festival of Fun: Probability Performance Task
Worksheet
A Festival of Fun: Probability Performance Task
Students demonstrate their proficiency with probability in this three-page performance task worksheet!
Seventh Grade
Data and Graphing
Worksheet
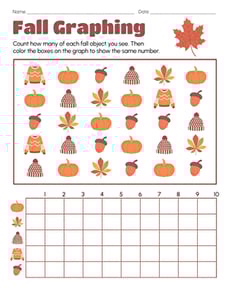
Fall Graphing
Worksheet
Fall Graphing
Kindergarten
Numbers and Counting
Get cozy with counting and graphing in this autumnal worksheet!
Worksheet
Fall Graphing
Worksheet
Fall Graphing
Get cozy with counting and graphing in this autumnal worksheet!
Kindergarten
Numbers and Counting
Worksheet
Oh! Those Shopping Carts! Are They Really Carriers of Bacteria?
Activity
Oh! Those Shopping Carts! Are They Really Carriers of Bacteria?
Measurement
Check out this cool middle school science fair project idea to determine if shopping carts are really carriers of harmful bacteria.
Activity
Oh! Those Shopping Carts! Are They Really Carriers of Bacteria?
Activity
Oh! Those Shopping Carts! Are They Really Carriers of Bacteria?
Check out this cool middle school science fair project idea to determine if shopping carts are really carriers of harmful bacteria.
Measurement
Activity
Cool It!
Activity
Cool It!
Measurement
Determine which environment keeps an ice cube frozen for the longest duration. Inspect and record your observations when cubes melt.
Activity
Cool It!
Activity
Cool It!
Determine which environment keeps an ice cube frozen for the longest duration. Inspect and record your observations when cubes melt.
Measurement
Activity
1
…
11
12
13
…
16