SKIP TO CONTENT
Worksheet Generator
Subjects
Grades
Worksheets
Games
Build a Worksheet
More Resources
Roly Recommends
Subjects
Grades
Worksheets
Games
Build a Worksheet
More Resources
Roly Recommends
Showing Results for students : Page 2
Filters
Math
Data and Graphing
162 results
Search for: students
✕
Math
✕
Common Core
✕
Clear all
162 results
Subtopics:
Collecting and Organizing Data
Picture Graphs
Bar Graphs
Line Plots
Coordinate Plane
Box Plots
Histograms
Scatter Plots
Show Less
Filters
Search for: students
✕
Math
✕
Common Core
✕
Subjects
Math
English Language Arts
Science
Social Studies
Technology
Grade Level
Pre-K
K
1st
2nd
3rd
4th
5th
6th
7th
8th
Early Childhood
Elementary School
Middle School
Resource Type
Worksheets
Games
Lesson Plans
Interactive Worksheets
Exercises
Offline Games
Teacher Resources
Occasion
Summer
Back to School
Halloween
Holidays
Valentine's Day
Common Core
Yes
Game Type
Printable Board Games
English Language Support
Yes
Clear all
View 162 results
Showing Results for students : Page 2
Filters
162 results
Search for: students
✕
Math
✕
Common Core
✕
Clear all
162 results
Experimental Probability Models
Worksheet
Experimental Probability Models
Seventh Grade
Data and Graphing
Use this seventh-grade math worksheet to introduce students to the concept of experimental probability models.
Worksheet
Experimental Probability Models
Worksheet
Experimental Probability Models
Use this seventh-grade math worksheet to introduce students to the concept of experimental probability models.
Seventh Grade
Data and Graphing
Worksheet
Collecting and Organizing Data 2
Exercise
Collecting and Organizing Data 2
Fourth Grade
Data and Graphing
Your students will grow adept at collecting and organizing data around them with this engaging exercise.
Exercise
Collecting and Organizing Data 2
Exercise
Collecting and Organizing Data 2
Your students will grow adept at collecting and organizing data around them with this engaging exercise.
Fourth Grade
Data and Graphing
Exercise
Collecting and Organizing Data 1
Exercise
Collecting and Organizing Data 1
Third Grade
Data and Graphing
Students will learn how to collect and organize data thanks to this interesting exercise from Education.com.
Exercise
Collecting and Organizing Data 1
Exercise
Collecting and Organizing Data 1
Students will learn how to collect and organize data thanks to this interesting exercise from Education.com.
Third Grade
Data and Graphing
Exercise
Intro to Probability: Marbles
Worksheet
Intro to Probability: Marbles
Fourth Grade
Data and Graphing
Introduce your students to probability concepts and fractions with a helpful and familiar visual aide.
Worksheet
Intro to Probability: Marbles
Worksheet
Intro to Probability: Marbles
Introduce your students to probability concepts and fractions with a helpful and familiar visual aide.
Fourth Grade
Data and Graphing
Worksheet
How Do You Measure Up?
Worksheet
How Do You Measure Up?
Fifth Grade
Fractions
Students will take practice measurements of real world objects and make a line plot of the data.
Worksheet
How Do You Measure Up?
Worksheet
How Do You Measure Up?
Students will take practice measurements of real world objects and make a line plot of the data.
Fifth Grade
Fractions
Worksheet
Simulate Compound Events #2
Worksheet
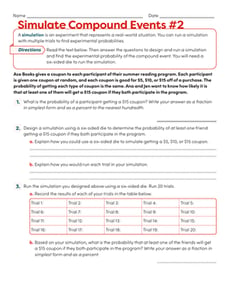
Simulate Compound Events #2
Seventh Grade
Data and Graphing
Give students additional practice designing and running a simulation to determine the probability of real-world compound events!
Worksheet
Simulate Compound Events #2
Worksheet
Simulate Compound Events #2
Give students additional practice designing and running a simulation to determine the probability of real-world compound events!
Seventh Grade
Data and Graphing
Worksheet
Simulate Compound Events #3
Worksheet
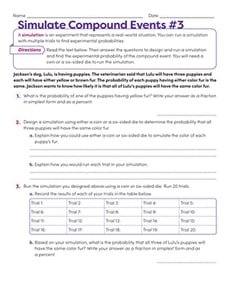
Simulate Compound Events #3
Seventh Grade
Data and Graphing
Give students more practice designing and running a simulation to determine the probability of real-world compound events!
Worksheet
Simulate Compound Events #3
Worksheet
Simulate Compound Events #3
Give students more practice designing and running a simulation to determine the probability of real-world compound events!
Seventh Grade
Data and Graphing
Worksheet
Rational Numbers on the Coordinate Plane
Worksheet
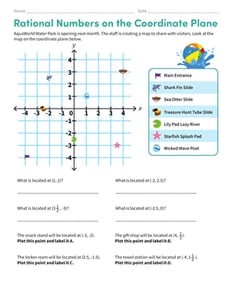
Rational Numbers on the Coordinate Plane
Sixth Grade
Integers and Rational Numbers
Students practice identifying and plotting ordered pairs on coordinate planes with this water park themed math worksheet!
Worksheet
Rational Numbers on the Coordinate Plane
Worksheet
Rational Numbers on the Coordinate Plane
Students practice identifying and plotting ordered pairs on coordinate planes with this water park themed math worksheet!
Sixth Grade
Integers and Rational Numbers
Worksheet
Mean, Median and Mode Madness!
Lesson Plan
Mean, Median and Mode Madness!
Third Grade
Data and Graphing
This lesson introduces students to the concepts of mean, median, and mode in a hands-on and visual way.
Lesson Plan
Mean, Median and Mode Madness!
Lesson Plan
Mean, Median and Mode Madness!
This lesson introduces students to the concepts of mean, median, and mode in a hands-on and visual way.
Third Grade
Data and Graphing
Lesson Plan
Sample Spaces of Compound Events
Worksheet
Sample Spaces of Compound Events
Seventh Grade
Data and Graphing
This seventh-grade math worksheet guides students through the process of finding the sample space of compound events.
Worksheet
Sample Spaces of Compound Events
Worksheet
Sample Spaces of Compound Events
This seventh-grade math worksheet guides students through the process of finding the sample space of compound events.
Seventh Grade
Data and Graphing
Worksheet
Mid-Year Math Assessment: Sorting Objects
Worksheet
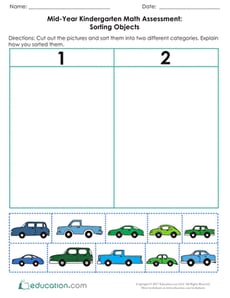
Mid-Year Math Assessment: Sorting Objects
Kindergarten
Data and Graphing
Assess your students’ understanding of sorting and categorizing using this helpful worksheet focusing on color, size, and number.
Worksheet
Mid-Year Math Assessment: Sorting Objects
Worksheet
Mid-Year Math Assessment: Sorting Objects
Assess your students’ understanding of sorting and categorizing using this helpful worksheet focusing on color, size, and number.
Kindergarten
Data and Graphing
Worksheet
Mean Absolute Deviation
Worksheet
Mean Absolute Deviation
Sixth Grade
Data and Graphing
Students calculate the mean absolute deviation of data sets in this sixth-grade date and graphing worksheet.
Worksheet
Mean Absolute Deviation
Worksheet
Mean Absolute Deviation
Students calculate the mean absolute deviation of data sets in this sixth-grade date and graphing worksheet.
Sixth Grade
Data and Graphing
Worksheet
Interpreting Data Using Graphs
Lesson Plan
Interpreting Data Using Graphs
Kindergarten
Data and Graphing
Engage students in learning about data by analyzing picture graphs, then collecting data from classmates and making their own graphs!
Lesson Plan
Interpreting Data Using Graphs
Lesson Plan
Interpreting Data Using Graphs
Engage students in learning about data by analyzing picture graphs, then collecting data from classmates and making their own graphs!
Kindergarten
Data and Graphing
Lesson Plan
Rotations on the Coordinate Plane
Worksheet
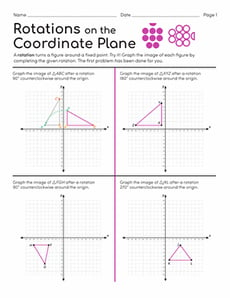
Rotations on the Coordinate Plane
Eighth Grade
Geometry
Students practice graphing images of figures after completing rotations of 90°, 180°, or 270° counterclockwise around the origin.
Worksheet
Rotations on the Coordinate Plane
Worksheet
Rotations on the Coordinate Plane
Students practice graphing images of figures after completing rotations of 90°, 180°, or 270° counterclockwise around the origin.
Eighth Grade
Geometry
Worksheet
Peachy Line Plots
Worksheet
Peachy Line Plots
Fifth Grade
Fractions
Students create their own peachy word problems by filling in the blanks, then create a line plot with the data.
Worksheet
Peachy Line Plots
Worksheet
Peachy Line Plots
Students create their own peachy word problems by filling in the blanks, then create a line plot with the data.
Fifth Grade
Fractions
Worksheet
Solving Systems of Linear Equations By Graphing, Substitution, and Elimination Guided Notes
Worksheet
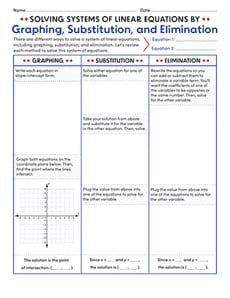
Solving Systems of Linear Equations By Graphing, Substitution, and Elimination Guided Notes
Eighth Grade
Algebra
Use these guided notes to give students confidence in solving systems of equations using graphing, substitution, and elimination methods!
Worksheet
Solving Systems of Linear Equations By Graphing, Substitution, and Elimination Guided Notes
Worksheet
Solving Systems of Linear Equations By Graphing, Substitution, and Elimination Guided Notes
Use these guided notes to give students confidence in solving systems of equations using graphing, substitution, and elimination methods!
Eighth Grade
Algebra
Worksheet
Interpreting Two-Way Frequency Tables
Worksheet
Interpreting Two-Way Frequency Tables
Eighth Grade
Data and Graphing
Students analyze two-way frequency tables in the context of relatable scenarios in this eighth-grade math worksheet!
Worksheet
Interpreting Two-Way Frequency Tables
Worksheet
Interpreting Two-Way Frequency Tables
Students analyze two-way frequency tables in the context of relatable scenarios in this eighth-grade math worksheet!
Eighth Grade
Data and Graphing
Worksheet
Feline Delights: Scatter Plots Performance Task
Worksheet
Feline Delights: Scatter Plots Performance Task
Eighth Grade
Algebra
Students apply their knowledge of statistics and probability in a real-world context in this two-page performance task!
Worksheet
Feline Delights: Scatter Plots Performance Task
Worksheet
Feline Delights: Scatter Plots Performance Task
Students apply their knowledge of statistics and probability in a real-world context in this two-page performance task!
Eighth Grade
Algebra
Worksheet
Blank Function Tables and Coordinate Planes
Worksheet
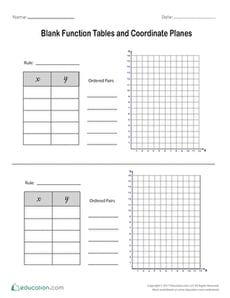
Blank Function Tables and Coordinate Planes
Fifth Grade
Geometry
Ask your students to use these blank function tables and coordinate planes to practice plotting ordered pairs.
Worksheet
Blank Function Tables and Coordinate Planes
Worksheet
Blank Function Tables and Coordinate Planes
Ask your students to use these blank function tables and coordinate planes to practice plotting ordered pairs.
Fifth Grade
Geometry
Worksheet
Estimating Lines of Best Fit
Worksheet
Estimating Lines of Best Fit
Eighth Grade
Data and Graphing
Students estimate and sketch lines of best fit on various scatter plots and describe the association displayed on each.
Worksheet
Estimating Lines of Best Fit
Worksheet
Estimating Lines of Best Fit
Students estimate and sketch lines of best fit on various scatter plots and describe the association displayed on each.
Eighth Grade
Data and Graphing
Worksheet
Translations on the Coordinate Plane
Worksheet
Translations on the Coordinate Plane
Eighth Grade
Geometry
In this eighth-grade geometry worksheet, students practice graphing images of figures after completing translations on a coordinate plane.
Worksheet
Translations on the Coordinate Plane
Worksheet
Translations on the Coordinate Plane
In this eighth-grade geometry worksheet, students practice graphing images of figures after completing translations on a coordinate plane.
Eighth Grade
Geometry
Worksheet
One of These Things Is Not Like The Other One (Part Four)
Worksheet
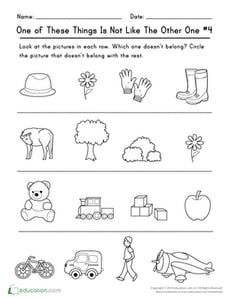
One of These Things Is Not Like The Other One (Part Four)
Kindergarten
Data and Graphing
This worksheet will challenge your students to think about the differences and similarities within a group of objects.
Worksheet
One of These Things Is Not Like The Other One (Part Four)
Worksheet
One of These Things Is Not Like The Other One (Part Four)
This worksheet will challenge your students to think about the differences and similarities within a group of objects.
Kindergarten
Data and Graphing
Worksheet
One of These Things Is Not Like The Other One (Part Three)
Worksheet
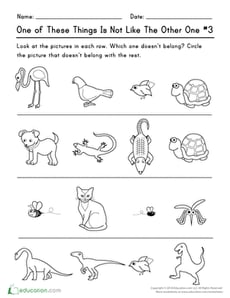
One of These Things Is Not Like The Other One (Part Three)
Kindergarten
Data and Graphing
With this worksheet, your students will have fun circling the objects that do not belong with the others.
Worksheet
One of These Things Is Not Like The Other One (Part Three)
Worksheet
One of These Things Is Not Like The Other One (Part Three)
With this worksheet, your students will have fun circling the objects that do not belong with the others.
Kindergarten
Data and Graphing
Worksheet
Reflections on the Coordinate Plane
Worksheet
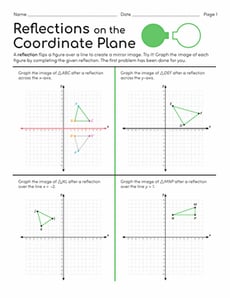
Reflections on the Coordinate Plane
Eighth Grade
Geometry
This eighth-grade geometry worksheet gives students practice graphing images of figures after completing given reflections on coordinate planes.
Worksheet
Reflections on the Coordinate Plane
Worksheet
Reflections on the Coordinate Plane
This eighth-grade geometry worksheet gives students practice graphing images of figures after completing given reflections on coordinate planes.
Eighth Grade
Geometry
Worksheet
Spring Math Assessment: Graphing
Worksheet
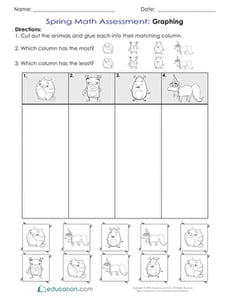
Spring Math Assessment: Graphing
Kindergarten
Data and Graphing
It’s springtime in kindergarten! Use this worksheet to assess your students’ knowledge of sorting objects and using picture graphs.
Worksheet
Spring Math Assessment: Graphing
Worksheet
Spring Math Assessment: Graphing
It’s springtime in kindergarten! Use this worksheet to assess your students’ knowledge of sorting objects and using picture graphs.
Kindergarten
Data and Graphing
Worksheet
Pet Survey
Worksheet
Pet Survey
First Grade
Data and Graphing
Have your students survey one another about pet preferences using this interactive activity designed to practice representing and interpreting data.
Worksheet
Pet Survey
Worksheet
Pet Survey
Have your students survey one another about pet preferences using this interactive activity designed to practice representing and interpreting data.
First Grade
Data and Graphing
Worksheet
Collecting and Organizing Data 3
Exercise
Collecting and Organizing Data 3
Fifth Grade
Data and Graphing
By the time students complete this third exercise in the series, they will have become masters of collecting and organizing data.
Exercise
Collecting and Organizing Data 3
Exercise
Collecting and Organizing Data 3
By the time students complete this third exercise in the series, they will have become masters of collecting and organizing data.
Fifth Grade
Data and Graphing
Exercise
Scatter Plots
Worksheet
Scatter Plots
Eighth Grade
Data and Graphing
Students practice identifying outliers and the types of associations shown on scatter plots in this eighth-grade data and graphing worksheet!
Worksheet
Scatter Plots
Worksheet
Scatter Plots
Students practice identifying outliers and the types of associations shown on scatter plots in this eighth-grade data and graphing worksheet!
Eighth Grade
Data and Graphing
Worksheet
Make Predictions Using Theoretical Probability
Interactive Worksheet
Make Predictions Using Theoretical Probability
Seventh Grade
Data and Graphing
In this seventh-grade probability worksheet, students will practice finding the theoretical probabilities for different events and using those to make predictions.
Interactive Worksheet
Make Predictions Using Theoretical Probability
Interactive Worksheet
Make Predictions Using Theoretical Probability
In this seventh-grade probability worksheet, students will practice finding the theoretical probabilities for different events and using those to make predictions.
Seventh Grade
Data and Graphing
Interactive Worksheet
Interpreting Slopes and y-Intercepts of Lines of Best Fit
Worksheet
Interpreting Slopes and y-Intercepts of Lines of Best Fit
Eighth Grade
Algebra
Students interpret slopes and
y
-intercepts of lines of best fit based on real-world scenarios in this eighth-grade worksheet!
Worksheet
Interpreting Slopes and y-Intercepts of Lines of Best Fit
Worksheet
Interpreting Slopes and y-Intercepts of Lines of Best Fit
Students interpret slopes and
y
-intercepts of lines of best fit based on real-world scenarios in this eighth-grade worksheet!
Eighth Grade
Algebra
Worksheet
1
2
3
4
5
6