SKIP TO CONTENT
Worksheet Generator
Subjects
Grades
Worksheets
Games
Build a Worksheet
More Resources
Roly Recommends
Subjects
Grades
Worksheets
Games
Build a Worksheet
More Resources
Roly Recommends
All Subjects
Math
Data and Graphing
Subtopics:
Collecting and Organizing Data
Picture Graphs
Bar Graphs
Line Plots
Coordinate Plane
Box Plots
Histograms
Scatter Plots
Show Less
Filters
Search for: using, lower, case
✕
Math
✕
Common Core
✕
Subjects
Math
English Language Arts
Science
Social Studies
Grade Level
Pre-K
K
1st
2nd
3rd
4th
5th
6th
7th
8th
Early Childhood
Elementary School
Middle School
Resource Type
Worksheets
Games
Lesson Plans
Interactive Worksheets
Activities
Teacher Resources
Occasion
Halloween
Holidays
Common Core
Yes
English Language Support
Yes
See More
Clear All
View 81 results
Showing Results for using lower case : Page 3
81 results
Search for: using, lower, case
✕
Math
✕
Common Core
✕
Clear All
Sort by:
Relevance
Most recent
Most popular
Alphabetical A-Z
Alphabetical Z-A
All filters
81 results
Sort by:
Relevance
Most recent
Most popular
Alphabetical A-Z
Alphabetical Z-A
Bar Graphs: Favorite Season
Worksheet
Bar Graphs: Favorite Season
Second Grade
Data and Graphing
Which season of the year is the best? Get your student ready for graphing with this fun bar graph worksheet!
Worksheet
Bar Graphs: Favorite Season
Worksheet
Bar Graphs: Favorite Season
Which season of the year is the best? Get your student ready for graphing with this fun bar graph worksheet!
Second Grade
Data and Graphing
Worksheet
Making Comparative Inferences
Worksheet
Making Comparative Inferences
Seventh Grade
Data and Graphing
Give students practice creating box plots and making comparative inferences with this seventh-grade math worksheet!
Worksheet
Making Comparative Inferences
Worksheet
Making Comparative Inferences
Give students practice creating box plots and making comparative inferences with this seventh-grade math worksheet!
Seventh Grade
Data and Graphing
Worksheet
Sample Spaces of Compound Events
Worksheet
Sample Spaces of Compound Events
Seventh Grade
Data and Graphing
This seventh-grade math worksheet guides students through the process of finding the sample space of compound events.
Worksheet
Sample Spaces of Compound Events
Worksheet
Sample Spaces of Compound Events
This seventh-grade math worksheet guides students through the process of finding the sample space of compound events.
Seventh Grade
Data and Graphing
Worksheet
Experimental Probability Models
Worksheet
Experimental Probability Models
Seventh Grade
Data and Graphing
Use this seventh-grade math worksheet to introduce students to the concept of experimental probability models.
Worksheet
Experimental Probability Models
Worksheet
Experimental Probability Models
Use this seventh-grade math worksheet to introduce students to the concept of experimental probability models.
Seventh Grade
Data and Graphing
Worksheet
Quilting Coordinates: Coordinate Plane Performance Task
Worksheet
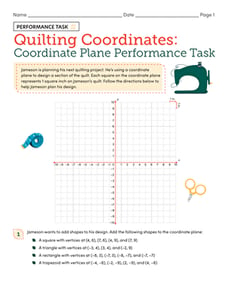
Quilting Coordinates: Coordinate Plane Performance Task
Sixth Grade
Geometry
Help Jameson plan his design for a quilting project in this coordinate plane performance task!
Worksheet
Quilting Coordinates: Coordinate Plane Performance Task
Worksheet
Quilting Coordinates: Coordinate Plane Performance Task
Help Jameson plan his design for a quilting project in this coordinate plane performance task!
Sixth Grade
Geometry
Worksheet
Describing Distributions in Dot Plots
Worksheet
Describing Distributions in Dot Plots
Sixth Grade
Data and Graphing
Students explore distributions in dot plots with this sixth-grade statistics worksheet!
Worksheet
Describing Distributions in Dot Plots
Worksheet
Describing Distributions in Dot Plots
Students explore distributions in dot plots with this sixth-grade statistics worksheet!
Sixth Grade
Data and Graphing
Worksheet
Reading Pictographs: Going to the Theater
Worksheet
Reading Pictographs: Going to the Theater
Third Grade
Data and Graphing
In this 3rd grade math worksheet, kids practice interpreting graph data as they use the information in a pictograph to answer a set of questions.
Worksheet
Reading Pictographs: Going to the Theater
Worksheet
Reading Pictographs: Going to the Theater
In this 3rd grade math worksheet, kids practice interpreting graph data as they use the information in a pictograph to answer a set of questions.
Third Grade
Data and Graphing
Worksheet
Make a Picture Graph
Worksheet
Make a Picture Graph
First Grade
Data and Graphing
In this math worksheet, children use picture graphs to tally up the total amounts of baked goods each party purchases.
Worksheet
Make a Picture Graph
Worksheet
Make a Picture Graph
In this math worksheet, children use picture graphs to tally up the total amounts of baked goods each party purchases.
First Grade
Data and Graphing
Worksheet
Go Organic! Practice Reading a Bar Graph
Worksheet
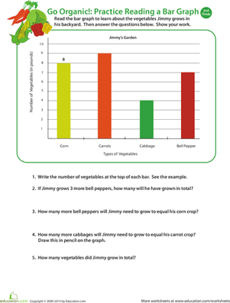
Go Organic! Practice Reading a Bar Graph
Second Grade
Data and Graphing
Boost your child's analytical thinking skills with this 2nd grade math worksheet in which he'll use data from a bar graph to answer word problems.
Worksheet
Go Organic! Practice Reading a Bar Graph
Worksheet
Go Organic! Practice Reading a Bar Graph
Boost your child's analytical thinking skills with this 2nd grade math worksheet in which he'll use data from a bar graph to answer word problems.
Second Grade
Data and Graphing
Worksheet
Favorite Cities Bar Graph
Worksheet
Favorite Cities Bar Graph
Second Grade
Data and Graphing
Can your second grader make her own bar chart? Use this pretend survey of 38 people and their favorite cities to find out!
Worksheet
Favorite Cities Bar Graph
Worksheet
Favorite Cities Bar Graph
Can your second grader make her own bar chart? Use this pretend survey of 38 people and their favorite cities to find out!
Second Grade
Data and Graphing
Worksheet
Box and Whisker Plot
Worksheet
Box and Whisker Plot
Sixth Grade
Data and Graphing
Students learn how to find the five-number summary and create a box and whisker plot for given data sets.
Worksheet
Box and Whisker Plot
Worksheet
Box and Whisker Plot
Students learn how to find the five-number summary and create a box and whisker plot for given data sets.
Sixth Grade
Data and Graphing
Worksheet
Mean, Median and Mode Madness!
Lesson Plan
Mean, Median and Mode Madness!
Third Grade
Data and Graphing
This lesson introduces students to the concepts of mean, median, and mode in a hands-on and visual way.
Lesson Plan
Mean, Median and Mode Madness!
Lesson Plan
Mean, Median and Mode Madness!
This lesson introduces students to the concepts of mean, median, and mode in a hands-on and visual way.
Third Grade
Data and Graphing
Lesson Plan
A Festival of Fun: Probability Performance Task
Worksheet
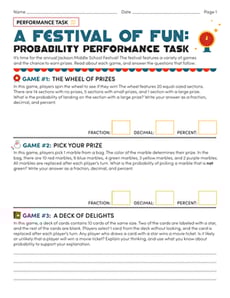
A Festival of Fun: Probability Performance Task
Seventh Grade
Data and Graphing
Students demonstrate their proficiency with probability in this three-page performance task worksheet!
Worksheet
A Festival of Fun: Probability Performance Task
Worksheet
A Festival of Fun: Probability Performance Task
Students demonstrate their proficiency with probability in this three-page performance task worksheet!
Seventh Grade
Data and Graphing
Worksheet
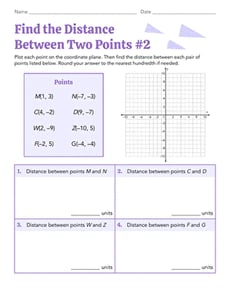
Find the Distance Between Two Points #2
Worksheet
Find the Distance Between Two Points #2
Eighth Grade
Geometry
Test your geometry skills and use the Pythagorean theorem in this eighth-grade worksheet!
Worksheet
Find the Distance Between Two Points #2
Worksheet
Find the Distance Between Two Points #2
Test your geometry skills and use the Pythagorean theorem in this eighth-grade worksheet!
Eighth Grade
Geometry
Worksheet
Find the Distance Between Two Points #1
Worksheet
Find the Distance Between Two Points #1
Eighth Grade
Geometry
Practice the Pythagorean theorem with this eighth-grade geometry worksheet!
Worksheet
Find the Distance Between Two Points #1
Worksheet
Find the Distance Between Two Points #1
Practice the Pythagorean theorem with this eighth-grade geometry worksheet!
Eighth Grade
Geometry
Worksheet
Mystery Picture Graph: All Hallow's Eve
Worksheet
Mystery Picture Graph: All Hallow's Eve
Fifth Grade
Geometry
The coordinate plane just got a little spookier! Can you graph these coordinates to reveal the hidden picture?
Worksheet
Mystery Picture Graph: All Hallow's Eve
Worksheet
Mystery Picture Graph: All Hallow's Eve
The coordinate plane just got a little spookier! Can you graph these coordinates to reveal the hidden picture?
Fifth Grade
Geometry
Worksheet
Tally Chart: At the Sushi Counter
Worksheet
Tally Chart: At the Sushi Counter
First Grade
Data and Graphing
The chef made a lot of sushi today during lunch. Can your child help him figure out how much sushi he made by filling in the table with tally marks?
Worksheet
Tally Chart: At the Sushi Counter
Worksheet
Tally Chart: At the Sushi Counter
The chef made a lot of sushi today during lunch. Can your child help him figure out how much sushi he made by filling in the table with tally marks?
First Grade
Data and Graphing
Worksheet
Math + Love = Valentine's Day Bar Graph
Lesson Plan
Math + Love = Valentine's Day Bar Graph
Second Grade
Data and Graphing
What's more romantic than a bar graph on Valentine's Day? In this Valentine's Day lesson plan, students will use information from a data set to create their own tally charts and bar graphs and then analyze these graphs to answer questions.
Lesson Plan
Math + Love = Valentine's Day Bar Graph
Lesson Plan
Math + Love = Valentine's Day Bar Graph
What's more romantic than a bar graph on Valentine's Day? In this Valentine's Day lesson plan, students will use information from a data set to create their own tally charts and bar graphs and then analyze these graphs to answer questions.
Second Grade
Data and Graphing
Lesson Plan
Mystery Picture Graph: Night Scene
Worksheet
Mystery Picture Graph: Night Scene
Fifth Grade
Geometry
Plot the coordinates on the grid to reveal a mystery picture in this two-page graphing worksheet!
Worksheet
Mystery Picture Graph: Night Scene
Worksheet
Mystery Picture Graph: Night Scene
Plot the coordinates on the grid to reveal a mystery picture in this two-page graphing worksheet!
Fifth Grade
Geometry
Worksheet
Graphing Colored Counters
Lesson Plan
Graphing Colored Counters
Kindergarten
Data and Graphing
In this lesson, your students will use the background knowledge that they have about counting and sorting to graph data. They will practice answering questions about the graph!
Lesson Plan
Graphing Colored Counters
Lesson Plan
Graphing Colored Counters
In this lesson, your students will use the background knowledge that they have about counting and sorting to graph data. They will practice answering questions about the graph!
Kindergarten
Data and Graphing
Lesson Plan
What is it Telling Me? Creating and Interpreting Line Plots
Lesson Plan
What is it Telling Me? Creating and Interpreting Line Plots
Third Grade
Data and Graphing
Line plots are a great way to introduce your students to graphing data. In this lesson, your students will learn how to create a line plot and also practice interpreting line plots.
Lesson Plan
What is it Telling Me? Creating and Interpreting Line Plots
Lesson Plan
What is it Telling Me? Creating and Interpreting Line Plots
Line plots are a great way to introduce your students to graphing data. In this lesson, your students will learn how to create a line plot and also practice interpreting line plots.
Third Grade
Data and Graphing
Lesson Plan
1
2
3