SKIP TO CONTENT
Worksheet Generator
Subjects
Grades
Worksheets
Games
Build a Worksheet
More Resources
Roly Recommends
Subjects
Grades
Worksheets
Games
Build a Worksheet
More Resources
Roly Recommends
All Subjects
Math
Data and Graphing
Subtopics:
Collecting and Organizing Data
Picture Graphs
Bar Graphs
Line Plots
Coordinate Plane
Box Plots
Histograms
Scatter Plots
Show Less
Filters
Search for: punctuation, practice
✕
Math
✕
Common Core
✕
Subjects
Math
English Language Arts
Science
Social Studies
Grade Level
Pre-K
K
1st
2nd
3rd
4th
5th
6th
7th
8th
Early Childhood
Elementary School
Middle School
Resource Type
Worksheets
Games
Lesson Plans
Interactive Worksheets
Workbooks
Activities
Exercises
Offline Games
Teacher Resources
Occasion
St. Patrick's Day
Easter
Earth Day
Summer
Halloween
Holidays
Christmas
Valentine's Day
Common Core
Yes
Game Type
Printable Board Games
Travel Games
English Language Support
Yes
See More
Clear All
View 175 results
Showing Results for punctuation practice : Page 6
175 results
Search for: punctuation, practice
✕
Math
✕
Common Core
✕
Clear All
Sort by:
Relevance
Most recent
Most popular
Alphabetical A-Z
Alphabetical Z-A
All filters
175 results
Sort by:
Relevance
Most recent
Most popular
Alphabetical A-Z
Alphabetical Z-A
Find the Distance Between Two Points on the Coordinate Plane
Interactive Worksheet
Find the Distance Between Two Points on the Coordinate Plane
Eighth Grade
Geometry
Did you know that you can use the Pythagorean theorem to find the distance between two points on the coordinate plane? Try it out with this eighth-grade geometry worksheet!
Interactive Worksheet
Find the Distance Between Two Points on the Coordinate Plane
Interactive Worksheet
Find the Distance Between Two Points on the Coordinate Plane
Did you know that you can use the Pythagorean theorem to find the distance between two points on the coordinate plane? Try it out with this eighth-grade geometry worksheet!
Eighth Grade
Geometry
Interactive Worksheet
Describing Distributions in Histograms
Worksheet
Describing Distributions in Histograms
Sixth Grade
Data and Graphing
Help students deepen their understanding of histograms with this this two-page data and graphing worksheet!
Worksheet
Describing Distributions in Histograms
Worksheet
Describing Distributions in Histograms
Help students deepen their understanding of histograms with this this two-page data and graphing worksheet!
Sixth Grade
Data and Graphing
Worksheet
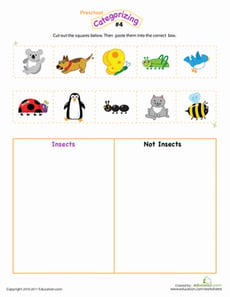
Cut and Categorize #4
Interactive Worksheet
Cut and Categorize #4
Pre-K
Data and Graphing
Which of these cute images are insects, and which are not? Can your preschooler put them into categories?
Interactive Worksheet
Cut and Categorize #4
Interactive Worksheet
Cut and Categorize #4
Which of these cute images are insects, and which are not? Can your preschooler put them into categories?
Pre-K
Data and Graphing
Interactive Worksheet
Graphing Data: Colors
Worksheet
Graphing Data: Colors
Second Grade
Data and Graphing
Help the concept of graphing really sink in by challenging your second grader to graph kids' favorite colors using a table, tally mark table, and grid.
Worksheet
Graphing Data: Colors
Worksheet
Graphing Data: Colors
Help the concept of graphing really sink in by challenging your second grader to graph kids' favorite colors using a table, tally mark table, and grid.
Second Grade
Data and Graphing
Worksheet
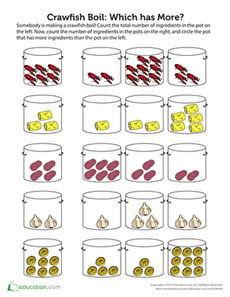
Crawfish Boil Counting Which Has More
Worksheet
Crawfish Boil Counting Which Has More
Kindergarten
Numbers and Counting
Some people eat crawfish in Bayou Country! Help your child compare pots of crawfish using terms such as greater than to see which pot has more.
Worksheet
Crawfish Boil Counting Which Has More
Worksheet
Crawfish Boil Counting Which Has More
Some people eat crawfish in Bayou Country! Help your child compare pots of crawfish using terms such as greater than to see which pot has more.
Kindergarten
Numbers and Counting
Worksheet
Comparing Pictographs: Taxi, Taxi
Worksheet
Comparing Pictographs: Taxi, Taxi
Third Grade
Addition
In this 3rd grade math worksheet, kids analyze and compare data in two pictographs in order to answer a set of word problems.
Worksheet
Comparing Pictographs: Taxi, Taxi
Worksheet
Comparing Pictographs: Taxi, Taxi
In this 3rd grade math worksheet, kids analyze and compare data in two pictographs in order to answer a set of word problems.
Third Grade
Addition
Worksheet
In the House: What Doesn't Belong?
Worksheet
In the House: What Doesn't Belong?
Pre-K
Data and Graphing
Does a crocodile or hot air balloon belong in the house? Challenge your little one to think logically to figure out what doesn't belong inside a house.
Worksheet
In the House: What Doesn't Belong?
Worksheet
In the House: What Doesn't Belong?
Does a crocodile or hot air balloon belong in the house? Challenge your little one to think logically to figure out what doesn't belong inside a house.
Pre-K
Data and Graphing
Worksheet
What Doesn't Belong?
Worksheet
What Doesn't Belong?
Pre-K
Data and Graphing
This worksheet is full of delicious and nutritious snacks, but there are a few things that don't belong!
Worksheet
What Doesn't Belong?
Worksheet
What Doesn't Belong?
This worksheet is full of delicious and nutritious snacks, but there are a few things that don't belong!
Pre-K
Data and Graphing
Worksheet
Graph It! What Kind of Pet Do You Have?
Worksheet
Graph It! What Kind of Pet Do You Have?
Kindergarten
Data and Graphing
This worksheet is perfect for the kid that asks, "When am I ever going to use math?" Conduct a pet survey with your child by using this pet graphing worksheet.
Worksheet
Graph It! What Kind of Pet Do You Have?
Worksheet
Graph It! What Kind of Pet Do You Have?
This worksheet is perfect for the kid that asks, "When am I ever going to use math?" Conduct a pet survey with your child by using this pet graphing worksheet.
Kindergarten
Data and Graphing
Worksheet
Graph Proportional Relationships #1
Worksheet
Graph Proportional Relationships #1
Eighth Grade
Ratios and Proportions
Help learners connect the constant of proportionality with the slope of a line in this one-page graphing worksheet!
Worksheet
Graph Proportional Relationships #1
Worksheet
Graph Proportional Relationships #1
Help learners connect the constant of proportionality with the slope of a line in this one-page graphing worksheet!
Eighth Grade
Ratios and Proportions
Worksheet
Interpreting Two-Way Frequency Tables
Worksheet
Interpreting Two-Way Frequency Tables
Eighth Grade
Data and Graphing
Students analyze two-way frequency tables in the context of relatable scenarios in this eighth-grade math worksheet!
Worksheet
Interpreting Two-Way Frequency Tables
Worksheet
Interpreting Two-Way Frequency Tables
Students analyze two-way frequency tables in the context of relatable scenarios in this eighth-grade math worksheet!
Eighth Grade
Data and Graphing
Worksheet
Solving Systems of Linear Equations By Graphing, Substitution, and Elimination Guided Notes
Worksheet
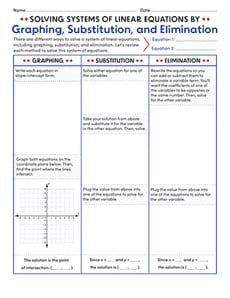
Solving Systems of Linear Equations By Graphing, Substitution, and Elimination Guided Notes
Eighth Grade
Algebra
Use these guided notes to give students confidence in solving systems of equations using graphing, substitution, and elimination methods!
Worksheet
Solving Systems of Linear Equations By Graphing, Substitution, and Elimination Guided Notes
Worksheet
Solving Systems of Linear Equations By Graphing, Substitution, and Elimination Guided Notes
Use these guided notes to give students confidence in solving systems of equations using graphing, substitution, and elimination methods!
Eighth Grade
Algebra
Worksheet
Weather Graph
Worksheet
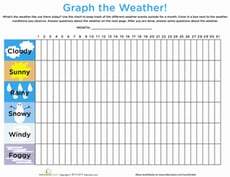
Weather Graph
First Grade
Data and Graphing
Observe and record the weather with your kindergartener with this cute fill-in weather graph.
Worksheet
Weather Graph
Worksheet
Weather Graph
Observe and record the weather with your kindergartener with this cute fill-in weather graph.
First Grade
Data and Graphing
Worksheet
Cut and Categorize #2
Worksheet
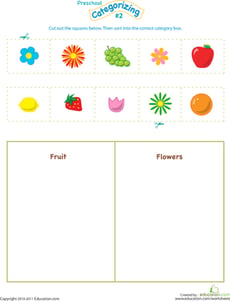
Cut and Categorize #2
Pre-K
Data and Graphing
Help your preschooler clue into categories with this adorable worksheet! It asks her to cut out each pretty picture, and then glue it into its proper spot.
Worksheet
Cut and Categorize #2
Worksheet
Cut and Categorize #2
Help your preschooler clue into categories with this adorable worksheet! It asks her to cut out each pretty picture, and then glue it into its proper spot.
Pre-K
Data and Graphing
Worksheet
On the Desk: What Doesn't Belong?
Worksheet
On the Desk: What Doesn't Belong?
Pre-K
Data and Graphing
Preschoolers are full of observations about the world around them. Get your child to apply what he knows by having him figure out what doesn't belong on a desk.
Worksheet
On the Desk: What Doesn't Belong?
Worksheet
On the Desk: What Doesn't Belong?
Preschoolers are full of observations about the world around them. Get your child to apply what he knows by having him figure out what doesn't belong on a desk.
Pre-K
Data and Graphing
Worksheet
Preschool Math: Day and Night
Worksheet
Preschool Math: Day and Night
Pre-K
Data and Graphing
Help your preschooler wrap her head around nighttime and daytime objects with this cute categorization worksheet.
Worksheet
Preschool Math: Day and Night
Worksheet
Preschool Math: Day and Night
Help your preschooler wrap her head around nighttime and daytime objects with this cute categorization worksheet.
Pre-K
Data and Graphing
Worksheet
Find the Distance Between Two Points #2
Worksheet
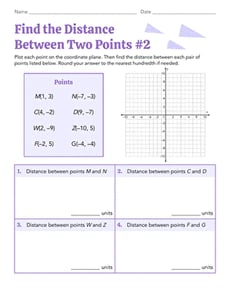
Find the Distance Between Two Points #2
Eighth Grade
Geometry
Test your geometry skills and use the Pythagorean theorem in this eighth-grade worksheet!
Worksheet
Find the Distance Between Two Points #2
Worksheet
Find the Distance Between Two Points #2
Test your geometry skills and use the Pythagorean theorem in this eighth-grade worksheet!
Eighth Grade
Geometry
Worksheet
Box Plots #2
Interactive Worksheet
Box Plots #2
Sixth Grade
Data and Graphing
Sixth graders will learn all about interpreting box plots in this helpful worksheet!
Interactive Worksheet
Box Plots #2
Interactive Worksheet
Box Plots #2
Sixth graders will learn all about interpreting box plots in this helpful worksheet!
Sixth Grade
Data and Graphing
Interactive Worksheet
Let's Draw: Create Line Plots
Worksheet
Let's Draw: Create Line Plots
Sixth Grade
Data and Graphing
Use data from a farmers' market to create your own line plots in this sixth-grade worksheet!
Worksheet
Let's Draw: Create Line Plots
Worksheet
Let's Draw: Create Line Plots
Use data from a farmers' market to create your own line plots in this sixth-grade worksheet!
Sixth Grade
Data and Graphing
Worksheet
Graph Basics: Line Graphs
Worksheet
Graph Basics: Line Graphs
Third Grade
Data and Graphing
Learn how to read, analyze, and create a line graph with this helpful math worksheet!
Worksheet
Graph Basics: Line Graphs
Worksheet
Graph Basics: Line Graphs
Learn how to read, analyze, and create a line graph with this helpful math worksheet!
Third Grade
Data and Graphing
Worksheet
Interpreting Slopes and y-Intercepts of Lines of Best Fit
Worksheet
Interpreting Slopes and y-Intercepts of Lines of Best Fit
Eighth Grade
Algebra
Students interpret slopes and
y
-intercepts of lines of best fit based on real-world scenarios in this eighth-grade worksheet!
Worksheet
Interpreting Slopes and y-Intercepts of Lines of Best Fit
Worksheet
Interpreting Slopes and y-Intercepts of Lines of Best Fit
Students interpret slopes and
y
-intercepts of lines of best fit based on real-world scenarios in this eighth-grade worksheet!
Eighth Grade
Algebra
Worksheet
EL
Nature Counting
Lesson Plan
Nature Counting
Kindergarten
Data and Graphing
Use this fun lesson plan to introduce or review the concept of addition to your ELs. Can be used as a stand alone or support lesson for the
Nature and Counting It All Adds Up
lesson plan.
Lesson Plan
EL
Nature Counting
Lesson Plan
Nature Counting
Use this fun lesson plan to introduce or review the concept of addition to your ELs. Can be used as a stand alone or support lesson for the
Nature and Counting It All Adds Up
lesson plan.
Kindergarten
Data and Graphing
Lesson Plan
Creating Box Plots
Worksheet
Creating Box Plots
Sixth Grade
Data and Graphing
Learn to draw your own box plots to show data in this informative sixth-grade worksheet!
Worksheet
Creating Box Plots
Worksheet
Creating Box Plots
Learn to draw your own box plots to show data in this informative sixth-grade worksheet!
Sixth Grade
Data and Graphing
Worksheet
Math + Love = Valentine's Day Bar Graph
Lesson Plan
Math + Love = Valentine's Day Bar Graph
Second Grade
Data and Graphing
What's more romantic than a bar graph on Valentine's Day? In this Valentine's Day lesson plan, students will use information from a data set to create their own tally charts and bar graphs and then analyze these graphs to answer questions.
Lesson Plan
Math + Love = Valentine's Day Bar Graph
Lesson Plan
Math + Love = Valentine's Day Bar Graph
What's more romantic than a bar graph on Valentine's Day? In this Valentine's Day lesson plan, students will use information from a data set to create their own tally charts and bar graphs and then analyze these graphs to answer questions.
Second Grade
Data and Graphing
Lesson Plan
Mean, Median and Mode Madness!
Lesson Plan
Mean, Median and Mode Madness!
Third Grade
Data and Graphing
This lesson introduces students to the concepts of mean, median, and mode in a hands-on and visual way.
Lesson Plan
Mean, Median and Mode Madness!
Lesson Plan
Mean, Median and Mode Madness!
This lesson introduces students to the concepts of mean, median, and mode in a hands-on and visual way.
Third Grade
Data and Graphing
Lesson Plan
1
2
3
4
5
6