SKIP TO CONTENT
Worksheet Generator
Subjects
Grades
Worksheets
Games
Build a Worksheet
More Resources
Roly Recommends
Math Month
Subjects
Grades
Worksheets
Games
Build a Worksheet
More Resources
Roly Recommends
Math Month
All Subjects
Math
Data and Graphing
Subtopics:
Collecting and Organizing Data
Picture Graphs
Bar Graphs
Line Plots
Coordinate Plane
Box Plots
Histograms
Scatter Plots
Show Less
Filters
Search for: tenth, grade, graph
✕
Math
✕
Subjects
Math
English Language Arts
Science
Social Studies
Foreign Language
Grade Level
Pre-K
K
1st
2nd
3rd
4th
5th
6th
7th
8th
Early Childhood
Elementary School
Middle School
Resource Type
Worksheets
Games
Lesson Plans
Interactive Worksheets
Workbooks
Activities
Exercises
Offline Games
Guided Lessons
Teacher Resources
Occasion
Birthdays
St. Patrick's Day
Summer
Independence Day
Back to School
Halloween
Winter
Holidays
Christmas
Hanukkah
Valentine's Day
Common Core
Yes
Game Type
Ball Games
Printable Board Games
Arts & Crafts
Arts & Crafts
Paper & Glue Crafts
English Language Support
Yes
See More
Clear All
View 370 results
Showing Results for tenth grade graph : Page 8
370 results
Search for: tenth, grade, graph
✕
Math
✕
Sort by:
Relevance
Most recent
Most popular
Alphabetical A-Z
Alphabetical Z-A
All filters
370 results
Sort by:
Relevance
Most recent
Most popular
Alphabetical A-Z
Alphabetical Z-A
Pie Chart Practice
Worksheet
Pie Chart Practice
Second Grade
Data and Graphing
Help your child get his bearings around charts and graphs with these cute pie chart worksheets.
Worksheet
Pie Chart Practice
Worksheet
Pie Chart Practice
Help your child get his bearings around charts and graphs with these cute pie chart worksheets.
Second Grade
Data and Graphing
Worksheet
Comparing Pictographs: Taxi, Taxi
Worksheet
Comparing Pictographs: Taxi, Taxi
Third Grade
Addition
In this 3rd grade math worksheet, kids analyze and compare data in two pictographs in order to answer a set of word problems.
Worksheet
Comparing Pictographs: Taxi, Taxi
Worksheet
Comparing Pictographs: Taxi, Taxi
In this 3rd grade math worksheet, kids analyze and compare data in two pictographs in order to answer a set of word problems.
Third Grade
Addition
Worksheet
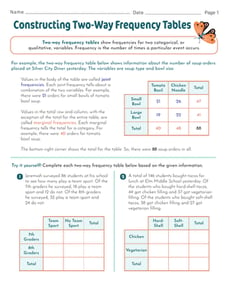
Constructing Two-Way Relative Frequency Tables
Interactive Worksheet
Constructing Two-Way Relative Frequency Tables
Eighth Grade
Data and Graphing
Practice creating two-way relative frequency tables based on real-world scenarios with this eighth-grade math worksheet!
Interactive Worksheet
Constructing Two-Way Relative Frequency Tables
Interactive Worksheet
Constructing Two-Way Relative Frequency Tables
Practice creating two-way relative frequency tables based on real-world scenarios with this eighth-grade math worksheet!
Eighth Grade
Data and Graphing
Interactive Worksheet
Practice Reading Venn Diagrams #2: In the Orchestra
Worksheet
Practice Reading Venn Diagrams #2: In the Orchestra
Second Grade
Data and Graphing
Kids practice reading a Venn diagram about instruments in an orchestra and answering questions about it in this 2nd grade math worksheet.
Worksheet
Practice Reading Venn Diagrams #2: In the Orchestra
Worksheet
Practice Reading Venn Diagrams #2: In the Orchestra
Kids practice reading a Venn diagram about instruments in an orchestra and answering questions about it in this 2nd grade math worksheet.
Second Grade
Data and Graphing
Worksheet
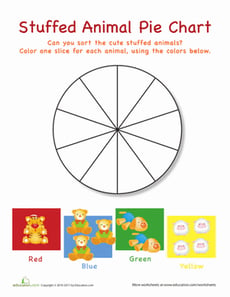
Zoo Animal Pie Chart
Worksheet
Zoo Animal Pie Chart
Second Grade
Data and Graphing
Help your child gain his bearings around charts and graphs with these cute, nonthreatening pie charts.
Worksheet
Zoo Animal Pie Chart
Worksheet
Zoo Animal Pie Chart
Help your child gain his bearings around charts and graphs with these cute, nonthreatening pie charts.
Second Grade
Data and Graphing
Worksheet
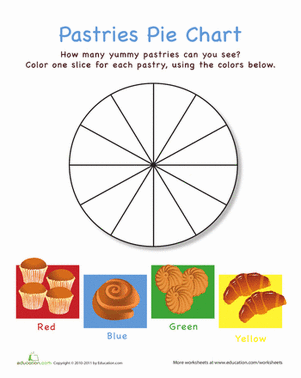
Pastries Pie Chart
Worksheet
Pastries Pie Chart
Second Grade
Data and Graphing
Help your child get her bearings around charts and graphs with this appealing pie chart worksheet.
Worksheet
Pastries Pie Chart
Worksheet
Pastries Pie Chart
Help your child get her bearings around charts and graphs with this appealing pie chart worksheet.
Second Grade
Data and Graphing
Worksheet
Make Predictions Using Theoretical Probability
Interactive Worksheet
Make Predictions Using Theoretical Probability
Seventh Grade
Data and Graphing
In this seventh-grade probability worksheet, students will practice finding the theoretical probabilities for different events and using those to make predictions.
Interactive Worksheet
Make Predictions Using Theoretical Probability
Interactive Worksheet
Make Predictions Using Theoretical Probability
In this seventh-grade probability worksheet, students will practice finding the theoretical probabilities for different events and using those to make predictions.
Seventh Grade
Data and Graphing
Interactive Worksheet
Experimental Probability
Worksheet
Experimental Probability
Seventh Grade
Data and Graphing
This seventh-grade math worksheet gives students a chance to find experimental probabilities using real-world scenarios in the form of word problems!
Worksheet
Experimental Probability
Worksheet
Experimental Probability
This seventh-grade math worksheet gives students a chance to find experimental probabilities using real-world scenarios in the form of word problems!
Seventh Grade
Data and Graphing
Worksheet
Track the Weather with Weather Charts
Activity
Track the Weather with Weather Charts
Third Grade
Measurement
Learn about the microclimate of your backyard by tracking rainfall, temperature, and observed weather with hand drawn charts and graphs.
Activity
Track the Weather with Weather Charts
Activity
Track the Weather with Weather Charts
Learn about the microclimate of your backyard by tracking rainfall, temperature, and observed weather with hand drawn charts and graphs.
Third Grade
Measurement
Activity
Addition Picture Graphs
Worksheet
Addition Picture Graphs
First Grade
Data and Graphing
Explore some stellar math concepts with this worksheet on adding multiple digits. Fill in the pictograph to help you visualize the problem first.
Worksheet
Addition Picture Graphs
Worksheet
Addition Picture Graphs
Explore some stellar math concepts with this worksheet on adding multiple digits. Fill in the pictograph to help you visualize the problem first.
First Grade
Data and Graphing
Worksheet
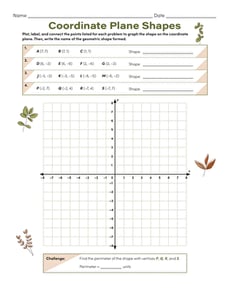
Coordinate Plane Shapes
Worksheet
Coordinate Plane Shapes
Sixth Grade
Data and Graphing
Give your students practice drawing polygons on the coordinate plane using given coordinates for the vertices with this sixth-grade geometry worksheet!
Worksheet
Coordinate Plane Shapes
Worksheet
Coordinate Plane Shapes
Give your students practice drawing polygons on the coordinate plane using given coordinates for the vertices with this sixth-grade geometry worksheet!
Sixth Grade
Data and Graphing
Worksheet
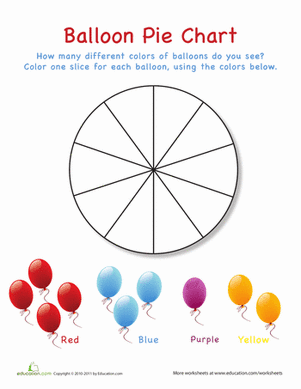
Balloon Pie Chart
Worksheet
Balloon Pie Chart
Second Grade
Data and Graphing
Help your child get his bearings around graphs and charts with this cute pie chart with plenty of kid appeal.
Worksheet
Balloon Pie Chart
Worksheet
Balloon Pie Chart
Help your child get his bearings around graphs and charts with this cute pie chart with plenty of kid appeal.
Second Grade
Data and Graphing
Worksheet
Make a Venn Diagram: Gift Boxes
Worksheet
Make a Venn Diagram: Gift Boxes
Second Grade
Data and Graphing
Kids practice making a Venn diagram about kinds of gift wrap by sorting the gifts in their correct spaces in this 2nd grade math worksheet.
Worksheet
Make a Venn Diagram: Gift Boxes
Worksheet
Make a Venn Diagram: Gift Boxes
Kids practice making a Venn diagram about kinds of gift wrap by sorting the gifts in their correct spaces in this 2nd grade math worksheet.
Second Grade
Data and Graphing
Worksheet
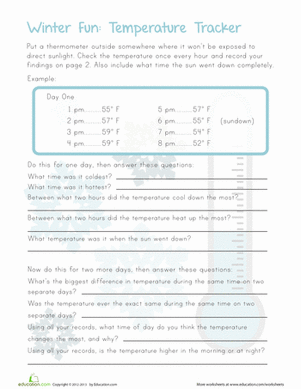
Winter Temperatures
Worksheet
Winter Temperatures
Fourth Grade
Measurement
Your meteorologist in the making will investigate changes in temperature as she practices charting and graphing data.
Worksheet
Winter Temperatures
Worksheet
Winter Temperatures
Your meteorologist in the making will investigate changes in temperature as she practices charting and graphing data.
Fourth Grade
Measurement
Worksheet
Pitch and Hit Data
Activity
Pitch and Hit Data
Third Grade
Data and Graphing
Okay, engaging in a graphing activity may sound ho-hum, but if you use fun data, it changes the picture entirely.
Activity
Pitch and Hit Data
Activity
Pitch and Hit Data
Okay, engaging in a graphing activity may sound ho-hum, but if you use fun data, it changes the picture entirely.
Third Grade
Data and Graphing
Activity
Make Predictions Using Experimental Probability
Interactive Worksheet
Make Predictions Using Experimental Probability
Seventh Grade
Data and Graphing
In this seventh-grade probability worksheet, students are introduced to the concept of experimental probability and shown how to use this information to make predictions.
Interactive Worksheet
Make Predictions Using Experimental Probability
Interactive Worksheet
Make Predictions Using Experimental Probability
In this seventh-grade probability worksheet, students are introduced to the concept of experimental probability and shown how to use this information to make predictions.
Seventh Grade
Data and Graphing
Interactive Worksheet
Interpreting Slopes and y-Intercepts of Lines of Best Fit
Worksheet
Interpreting Slopes and y-Intercepts of Lines of Best Fit
Eighth Grade
Algebra
Students interpret slopes and
y
-intercepts of lines of best fit based on real-world scenarios in this eighth-grade worksheet!
Worksheet
Interpreting Slopes and y-Intercepts of Lines of Best Fit
Worksheet
Interpreting Slopes and y-Intercepts of Lines of Best Fit
Students interpret slopes and
y
-intercepts of lines of best fit based on real-world scenarios in this eighth-grade worksheet!
Eighth Grade
Algebra
Worksheet
Constructing Two-Way Frequency Tables
Interactive Worksheet
Constructing Two-Way Frequency Tables
Eighth Grade
Data and Graphing
In this eighth-grade math worksheet, learners will then get to practice constructing two-way frequency tables given written descriptions of real-world data.
Interactive Worksheet
Constructing Two-Way Frequency Tables
Interactive Worksheet
Constructing Two-Way Frequency Tables
In this eighth-grade math worksheet, learners will then get to practice constructing two-way frequency tables given written descriptions of real-world data.
Eighth Grade
Data and Graphing
Interactive Worksheet
Bike Pictograph Questions
Worksheet
Bike Pictograph Questions
Second Grade
Data and Graphing
With these pictograph questions, your kid will hone his skills at reading and interpreting graphs.
Worksheet
Bike Pictograph Questions
Worksheet
Bike Pictograph Questions
With these pictograph questions, your kid will hone his skills at reading and interpreting graphs.
Second Grade
Data and Graphing
Worksheet
Coordinate Challenge: Treasure Hunt!
Worksheet
Coordinate Challenge: Treasure Hunt!
Sixth Grade
Data and Graphing
Sixth graders will mine four quadrants for gems in this data and graphing worksheet.
Worksheet
Coordinate Challenge: Treasure Hunt!
Worksheet
Coordinate Challenge: Treasure Hunt!
Sixth graders will mine four quadrants for gems in this data and graphing worksheet.
Sixth Grade
Data and Graphing
Worksheet
Create a Line Plot with Data Provided
Worksheet
Create a Line Plot with Data Provided
Third Grade
Data and Graphing
Use the data provided to have your students create a line plot that reflects how much TV watched per week for one third grade class.
Worksheet
Create a Line Plot with Data Provided
Worksheet
Create a Line Plot with Data Provided
Use the data provided to have your students create a line plot that reflects how much TV watched per week for one third grade class.
Third Grade
Data and Graphing
Worksheet
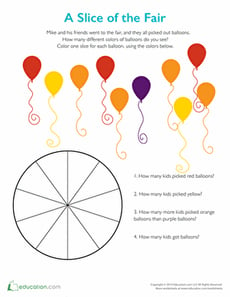
A Slice of the Fair: Pie Chart for Kids
Worksheet
A Slice of the Fair: Pie Chart for Kids
Second Grade
Data and Graphing
Who doesn't love a slice of pie and balloons? Color the different slices in this pie chart for kids to learn more about graphing.
Worksheet
A Slice of the Fair: Pie Chart for Kids
Worksheet
A Slice of the Fair: Pie Chart for Kids
Who doesn't love a slice of pie and balloons? Color the different slices in this pie chart for kids to learn more about graphing.
Second Grade
Data and Graphing
Worksheet
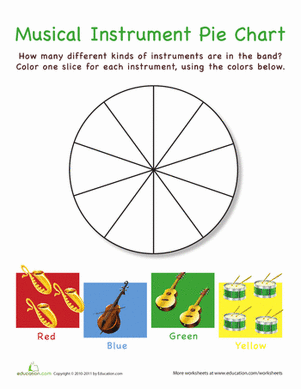
Musical Instruments Pie Chart
Worksheet
Musical Instruments Pie Chart
Second Grade
Data and Graphing
Pie makes pretty much anything better, especially math. Help your kid learn about graphs with this nonthreatening pie chart featuring musical instruments.
Worksheet
Musical Instruments Pie Chart
Worksheet
Musical Instruments Pie Chart
Pie makes pretty much anything better, especially math. Help your kid learn about graphs with this nonthreatening pie chart featuring musical instruments.
Second Grade
Data and Graphing
Worksheet
Drawing Inferences Using Data
Worksheet
Drawing Inferences Using Data
Seventh Grade
Data and Graphing
Students compare different survey methods to make inferences about how much time students at a school spend playing video games in this seventh-grade math worksheet.
Worksheet
Drawing Inferences Using Data
Worksheet
Drawing Inferences Using Data
Students compare different survey methods to make inferences about how much time students at a school spend playing video games in this seventh-grade math worksheet.
Seventh Grade
Data and Graphing
Worksheet
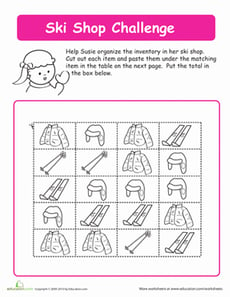
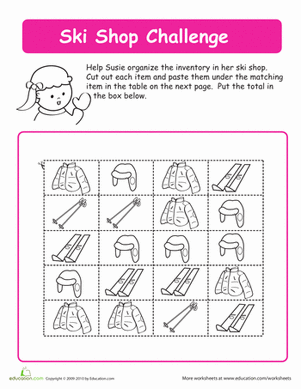
Practice Sorting and Counting at the Ski Shop
Worksheet
Practice Sorting and Counting at the Ski Shop
Kindergarten
Numbers and Counting
Help Susie organize the inventory at her ski shop in this kindergarten math worksheet. Your child will practice sorting, graphing, and counting.
Worksheet
Practice Sorting and Counting at the Ski Shop
Worksheet
Practice Sorting and Counting at the Ski Shop
Help Susie organize the inventory at her ski shop in this kindergarten math worksheet. Your child will practice sorting, graphing, and counting.
Kindergarten
Numbers and Counting
Worksheet
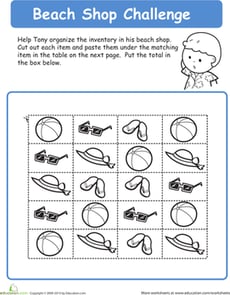
Practice Sorting and Counting at the Beach
Worksheet
Practice Sorting and Counting at the Beach
Kindergarten
Numbers and Counting
Help Tony organize the inventory at his beach shop in this kindergarten math worksheet. Your child will practice sorting, graphing, and counting.
Worksheet
Practice Sorting and Counting at the Beach
Worksheet
Practice Sorting and Counting at the Beach
Help Tony organize the inventory at his beach shop in this kindergarten math worksheet. Your child will practice sorting, graphing, and counting.
Kindergarten
Numbers and Counting
Worksheet
Rescue Mission: Graphing on a Coordinate Plane
Game
Rescue Mission: Graphing on a Coordinate Plane
Sixth Grade
Data and Graphing
Learners plot (x, y) coordinates on a plane to locate an emergency situation in this fun math game!
Game
Rescue Mission: Graphing on a Coordinate Plane
Game
Rescue Mission: Graphing on a Coordinate Plane
Learners plot (x, y) coordinates on a plane to locate an emergency situation in this fun math game!
Sixth Grade
Data and Graphing
Game
Flower Pie Chart
Worksheet
Flower Pie Chart
Second Grade
Data and Graphing
Even if your child isn't ready for statistics, he can learn to get his bearings around charts and graphs with this simple flower-themed pie chart worksheet.
Worksheet
Flower Pie Chart
Worksheet
Flower Pie Chart
Even if your child isn't ready for statistics, he can learn to get his bearings around charts and graphs with this simple flower-themed pie chart worksheet.
Second Grade
Data and Graphing
Worksheet
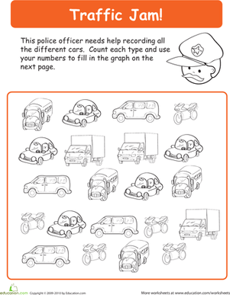
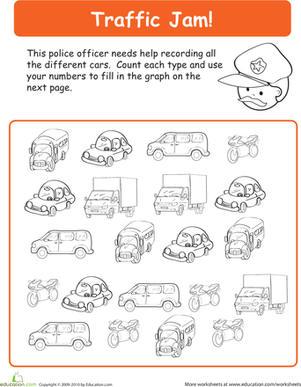
Practice Sorting and Counting in a Traffic Jam
Worksheet
Practice Sorting and Counting in a Traffic Jam
Kindergarten
Numbers and Counting
Help the police officer record the cars in the traffic jam in this kindergarten math worksheet. Your child will practice sorting, graphing, and counting.
Worksheet
Practice Sorting and Counting in a Traffic Jam
Worksheet
Practice Sorting and Counting in a Traffic Jam
Help the police officer record the cars in the traffic jam in this kindergarten math worksheet. Your child will practice sorting, graphing, and counting.
Kindergarten
Numbers and Counting
Worksheet
Reading Pictographs: Drink Your Milk!
Worksheet
Reading Pictographs: Drink Your Milk!
Third Grade
Data and Graphing
Can your child help Tommy figure out how much milk he drinks? As she does, she'll learn how to read and interpret data in graphs and practice multiplication.
Worksheet
Reading Pictographs: Drink Your Milk!
Worksheet
Reading Pictographs: Drink Your Milk!
Can your child help Tommy figure out how much milk he drinks? As she does, she'll learn how to read and interpret data in graphs and practice multiplication.
Third Grade
Data and Graphing
Worksheet
1
…
7
8
9
…
13