SKIP TO CONTENT
Worksheet Generator
Subjects
Grades
Worksheets
Games
Build a Worksheet
More Resources
Roly Recommends
Subjects
Grades
Worksheets
Games
Build a Worksheet
More Resources
Roly Recommends
All Subjects
Math
Data and Graphing
Subtopics:
Collecting and Organizing Data
Picture Graphs
Bar Graphs
Line Plots
Coordinate Plane
Box Plots
Histograms
Scatter Plots
Show Less
Filters
Search for: interpretting, data, using, graphs, recipes
✕
Math
✕
Subjects
Math
English Language Arts
Science
Social Studies
Foreign Language
Grade Level
Pre-K
K
1st
2nd
3rd
4th
5th
6th
7th
8th
Early Childhood
Elementary School
Middle School
Resource Type
Worksheets
Games
Lesson Plans
Interactive Worksheets
Workbooks
Activities
Exercises
Offline Games
Guided Lessons
Teacher Resources
Occasion
Birthdays
St. Patrick's Day
Summer
Back to School
Halloween
Winter
Holidays
Valentine's Day
Common Core
Yes
Game Type
Ball Games
Arts & Crafts
Arts & Crafts
Paper & Glue Crafts
Construction & Sculpture
Painting & Drawing
Recycled Crafts
English Language Support
Yes
See More
Clear All
View 337 results
Showing Results for interpretting data using graphs recipes : Page 9
337 results
Search for: interpretting, data, using, graphs, recipes
✕
Math
✕
Sort by:
Relevance
Most recent
Most popular
Alphabetical A-Z
Alphabetical Z-A
All filters
337 results
Sort by:
Relevance
Most recent
Most popular
Alphabetical A-Z
Alphabetical Z-A
Mystery Picture Graph: Night Scene
Worksheet
Mystery Picture Graph: Night Scene
Fifth Grade
Geometry
Plot the coordinates on the grid to reveal a mystery picture in this two-page graphing worksheet!
Worksheet
Mystery Picture Graph: Night Scene
Worksheet
Mystery Picture Graph: Night Scene
Plot the coordinates on the grid to reveal a mystery picture in this two-page graphing worksheet!
Fifth Grade
Geometry
Worksheet
Practice Reading Venn Diagrams #1: Favorite Hobby
Worksheet
Practice Reading Venn Diagrams #1: Favorite Hobby
Second Grade
Data and Graphing
Kids practice reading a Venn diagram about favorite hobbies and answer questions about it in this 2nd grade math worksheet.
Worksheet
Practice Reading Venn Diagrams #1: Favorite Hobby
Worksheet
Practice Reading Venn Diagrams #1: Favorite Hobby
Kids practice reading a Venn diagram about favorite hobbies and answer questions about it in this 2nd grade math worksheet.
Second Grade
Data and Graphing
Worksheet
Practice Reading Venn Diagrams #3: Favorite Dessert
Worksheet
Practice Reading Venn Diagrams #3: Favorite Dessert
Second Grade
Data and Graphing
Kids practice reading a Venn diagram about favorite desserts and answer questions about it in this 2nd grade math worksheet.
Worksheet
Practice Reading Venn Diagrams #3: Favorite Dessert
Worksheet
Practice Reading Venn Diagrams #3: Favorite Dessert
Kids practice reading a Venn diagram about favorite desserts and answer questions about it in this 2nd grade math worksheet.
Second Grade
Data and Graphing
Worksheet
Experimental Probability Models
Worksheet
Experimental Probability Models
Seventh Grade
Data and Graphing
Use this seventh-grade math worksheet to introduce students to the concept of experimental probability models.
Worksheet
Experimental Probability Models
Worksheet
Experimental Probability Models
Use this seventh-grade math worksheet to introduce students to the concept of experimental probability models.
Seventh Grade
Data and Graphing
Worksheet
Ice Cream Graph #15
Worksheet
Ice Cream Graph #15
First Grade
Data and Graphing
Three kids set up an ice cream stand, but they need your child's help figuring out how much they sold. Help Sam, Kate, and Becky calculate their sales and more.
Worksheet
Ice Cream Graph #15
Worksheet
Ice Cream Graph #15
Three kids set up an ice cream stand, but they need your child's help figuring out how much they sold. Help Sam, Kate, and Becky calculate their sales and more.
First Grade
Data and Graphing
Worksheet
Practice Reading Venn Diagrams #2: In the Orchestra
Worksheet
Practice Reading Venn Diagrams #2: In the Orchestra
Second Grade
Data and Graphing
Kids practice reading a Venn diagram about instruments in an orchestra and answering questions about it in this 2nd grade math worksheet.
Worksheet
Practice Reading Venn Diagrams #2: In the Orchestra
Worksheet
Practice Reading Venn Diagrams #2: In the Orchestra
Kids practice reading a Venn diagram about instruments in an orchestra and answering questions about it in this 2nd grade math worksheet.
Second Grade
Data and Graphing
Worksheet
Learning Charts
Worksheet
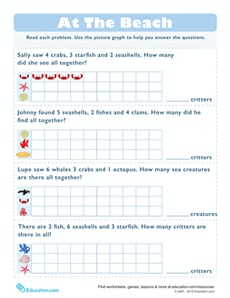
Learning Charts
First Grade
Data and Graphing
Take math practice to the beach with this intro to pictographs! Practice drawing each word problem on the chart.
Worksheet
Learning Charts
Worksheet
Learning Charts
Take math practice to the beach with this intro to pictographs! Practice drawing each word problem on the chart.
First Grade
Data and Graphing
Worksheet
Picture Graphing with Fish
Game
Picture Graphing with Fish
Third Grade
Data and Graphing
Fish, fish everywhere! Kids catch fish to sort and graph in this zany game.
Game
Picture Graphing with Fish
Game
Picture Graphing with Fish
Fish, fish everywhere! Kids catch fish to sort and graph in this zany game.
Third Grade
Data and Graphing
Game
Constructing Two-Way Relative Frequency Tables
Interactive Worksheet
Constructing Two-Way Relative Frequency Tables
Eighth Grade
Data and Graphing
Practice creating two-way relative frequency tables based on real-world scenarios with this eighth-grade math worksheet!
Interactive Worksheet
Constructing Two-Way Relative Frequency Tables
Interactive Worksheet
Constructing Two-Way Relative Frequency Tables
Practice creating two-way relative frequency tables based on real-world scenarios with this eighth-grade math worksheet!
Eighth Grade
Data and Graphing
Interactive Worksheet
Ice Cream Graph #19
Worksheet
Ice Cream Graph #19
First Grade
Data and Graphing
Ice cream for sale! Sam, Kate, and Becky need help keeping track of how many ice cream cones they've sold. Your child will complete a pictograph to help them.
Worksheet
Ice Cream Graph #19
Worksheet
Ice Cream Graph #19
Ice cream for sale! Sam, Kate, and Becky need help keeping track of how many ice cream cones they've sold. Your child will complete a pictograph to help them.
First Grade
Data and Graphing
Worksheet
Basic Pictographs
Worksheet
Basic Pictographs
First Grade
Data and Graphing
Practice adding multiple digits with a fun pictograph page. Use the chart to draw out the number of items in each problem.
Worksheet
Basic Pictographs
Worksheet
Basic Pictographs
Practice adding multiple digits with a fun pictograph page. Use the chart to draw out the number of items in each problem.
First Grade
Data and Graphing
Worksheet
Make a Venn Diagram: Gift Boxes
Worksheet
Make a Venn Diagram: Gift Boxes
Second Grade
Data and Graphing
Kids practice making a Venn diagram about kinds of gift wrap by sorting the gifts in their correct spaces in this 2nd grade math worksheet.
Worksheet
Make a Venn Diagram: Gift Boxes
Worksheet
Make a Venn Diagram: Gift Boxes
Kids practice making a Venn diagram about kinds of gift wrap by sorting the gifts in their correct spaces in this 2nd grade math worksheet.
Second Grade
Data and Graphing
Worksheet
Graph It! How Many Siblings Do You Have?
Worksheet
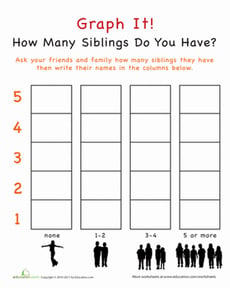
Graph It! How Many Siblings Do You Have?
Kindergarten
Data and Graphing
Use this Graph It! worksheet to show your child the practical side of math. This graphing exercise gets your child to survey his friends on their siblings.
Worksheet
Graph It! How Many Siblings Do You Have?
Worksheet
Graph It! How Many Siblings Do You Have?
Use this Graph It! worksheet to show your child the practical side of math. This graphing exercise gets your child to survey his friends on their siblings.
Kindergarten
Data and Graphing
Worksheet
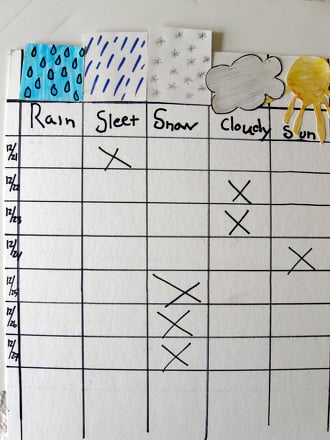
Make a Winter Weather Pictograph
Activity
Make a Winter Weather Pictograph
First Grade
Data and Graphing
Encourage your kindergartener to investigate and chronicle the weather she observes during the coldest months of the year.
Activity
Make a Winter Weather Pictograph
Activity
Make a Winter Weather Pictograph
Encourage your kindergartener to investigate and chronicle the weather she observes during the coldest months of the year.
First Grade
Data and Graphing
Activity
Interpreting Line Plots with Fractional Units
Worksheet
Interpreting Line Plots with Fractional Units
Third Grade
Data and Graphing
In this third grade worksheet, kids will interpret a line plot that includes fractional units.
Worksheet
Interpreting Line Plots with Fractional Units
Worksheet
Interpreting Line Plots with Fractional Units
In this third grade worksheet, kids will interpret a line plot that includes fractional units.
Third Grade
Data and Graphing
Worksheet
Make a Family Fridge Graph
Activity
Make a Family Fridge Graph
First Grade
Data and Graphing
Make a fun refrigerator graph with your first grader in order to help her develop those crucial graphing skills, while engaging with the whole family.
Activity
Make a Family Fridge Graph
Activity
Make a Family Fridge Graph
Make a fun refrigerator graph with your first grader in order to help her develop those crucial graphing skills, while engaging with the whole family.
First Grade
Data and Graphing
Activity
Feline Delights: Scatter Plots Performance Task
Worksheet
Feline Delights: Scatter Plots Performance Task
Eighth Grade
Algebra
Students apply their knowledge of statistics and probability in a real-world context in this two-page performance task!
Worksheet
Feline Delights: Scatter Plots Performance Task
Worksheet
Feline Delights: Scatter Plots Performance Task
Students apply their knowledge of statistics and probability in a real-world context in this two-page performance task!
Eighth Grade
Algebra
Worksheet
Ice Cream Graph #11
Worksheet
Ice Cream Graph #11
First Grade
Data and Graphing
Sam, Kate and Becky are having an ice cream sale. Help them keep track of their sales by filling in a pictograph, and then answer a few math questions.
Worksheet
Ice Cream Graph #11
Worksheet
Ice Cream Graph #11
Sam, Kate and Becky are having an ice cream sale. Help them keep track of their sales by filling in a pictograph, and then answer a few math questions.
First Grade
Data and Graphing
Worksheet
Ice Cream Graph #16
Worksheet
Ice Cream Graph #16
First Grade
Data and Graphing
Sam, Kate and Becky are having an ice cream sale. Help them keep track of their sales by drawing in a pictograph, and then answer a few math questions.
Worksheet
Ice Cream Graph #16
Worksheet
Ice Cream Graph #16
Sam, Kate and Becky are having an ice cream sale. Help them keep track of their sales by drawing in a pictograph, and then answer a few math questions.
First Grade
Data and Graphing
Worksheet
Interpreting Slopes and y-Intercepts of Lines of Best Fit
Worksheet
Interpreting Slopes and y-Intercepts of Lines of Best Fit
Eighth Grade
Algebra
Students interpret slopes and
y
-intercepts of lines of best fit based on real-world scenarios in this eighth-grade worksheet!
Worksheet
Interpreting Slopes and y-Intercepts of Lines of Best Fit
Worksheet
Interpreting Slopes and y-Intercepts of Lines of Best Fit
Students interpret slopes and
y
-intercepts of lines of best fit based on real-world scenarios in this eighth-grade worksheet!
Eighth Grade
Algebra
Worksheet
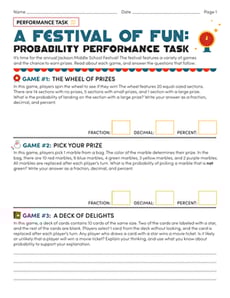
A Festival of Fun: Probability Performance Task
Worksheet
A Festival of Fun: Probability Performance Task
Seventh Grade
Data and Graphing
Students demonstrate their proficiency with probability in this three-page performance task worksheet!
Worksheet
A Festival of Fun: Probability Performance Task
Worksheet
A Festival of Fun: Probability Performance Task
Students demonstrate their proficiency with probability in this three-page performance task worksheet!
Seventh Grade
Data and Graphing
Worksheet
Favorite Foods
Worksheet
Favorite Foods
First Grade
Data and Graphing
Your child can learn to create a bar graph while having fun asking people questions.
Worksheet
Favorite Foods
Worksheet
Favorite Foods
Your child can learn to create a bar graph while having fun asking people questions.
First Grade
Data and Graphing
Worksheet
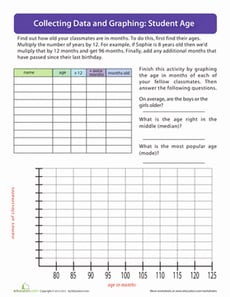
Student Age
Worksheet
Student Age
Third Grade
Data and Graphing
Get to know your classmates with a fun polling and graphing activity. Kids will use their math skills to find the ages of their classmates in months.
Worksheet
Student Age
Worksheet
Student Age
Get to know your classmates with a fun polling and graphing activity. Kids will use their math skills to find the ages of their classmates in months.
Third Grade
Data and Graphing
Worksheet
Estimating Lines of Best Fit
Worksheet
Estimating Lines of Best Fit
Eighth Grade
Data and Graphing
Students estimate and sketch lines of best fit on various scatter plots and describe the association displayed on each.
Worksheet
Estimating Lines of Best Fit
Worksheet
Estimating Lines of Best Fit
Students estimate and sketch lines of best fit on various scatter plots and describe the association displayed on each.
Eighth Grade
Data and Graphing
Worksheet
Tally Chart: At the Sushi Counter
Worksheet
Tally Chart: At the Sushi Counter
First Grade
Data and Graphing
The chef made a lot of sushi today during lunch. Can your child help him figure out how much sushi he made by filling in the table with tally marks?
Worksheet
Tally Chart: At the Sushi Counter
Worksheet
Tally Chart: At the Sushi Counter
The chef made a lot of sushi today during lunch. Can your child help him figure out how much sushi he made by filling in the table with tally marks?
First Grade
Data and Graphing
Worksheet
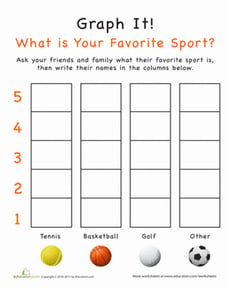
Graph It! What is Your Favorite Sport?
Worksheet
Graph It! What is Your Favorite Sport?
Kindergarten
Data and Graphing
Kids who think math is impractical and boring will learn something new, and have fun, with our worksheet. Your child will survey friends about favorite sports.
Worksheet
Graph It! What is Your Favorite Sport?
Worksheet
Graph It! What is Your Favorite Sport?
Kids who think math is impractical and boring will learn something new, and have fun, with our worksheet. Your child will survey friends about favorite sports.
Kindergarten
Data and Graphing
Worksheet
Hiking Buddies Pictograph
Worksheet
Hiking Buddies Pictograph
Second Grade
Data and Graphing
This pictograph shows how many hikes Eric and his friends went on this month. Use the information to answer questions and determine who hiked the most.
Worksheet
Hiking Buddies Pictograph
Worksheet
Hiking Buddies Pictograph
This pictograph shows how many hikes Eric and his friends went on this month. Use the information to answer questions and determine who hiked the most.
Second Grade
Data and Graphing
Worksheet
Understanding Charts: Muscleville Medals!
Worksheet
Understanding Charts: Muscleville Medals!
Third Grade
Data and Graphing
Looking for a worksheet to practice your third grader's chart reading skills? This printable works with interpreting charts.
Worksheet
Understanding Charts: Muscleville Medals!
Worksheet
Understanding Charts: Muscleville Medals!
Looking for a worksheet to practice your third grader's chart reading skills? This printable works with interpreting charts.
Third Grade
Data and Graphing
Worksheet
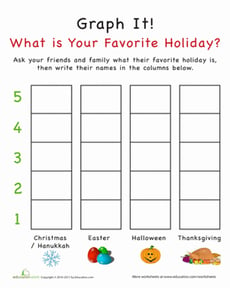
Graph It! What is Your Favorite Holiday?
Worksheet
Graph It! What is Your Favorite Holiday?
Kindergarten
Data and Graphing
Help your child conduct a study, all about his friends' favorite holidays. Our holiday graphing worksheet is a fun way to show your kid practical uses for math.
Worksheet
Graph It! What is Your Favorite Holiday?
Worksheet
Graph It! What is Your Favorite Holiday?
Help your child conduct a study, all about his friends' favorite holidays. Our holiday graphing worksheet is a fun way to show your kid practical uses for math.
Kindergarten
Data and Graphing
Worksheet
Interpreting Two-Way Frequency Tables
Worksheet
Interpreting Two-Way Frequency Tables
Eighth Grade
Data and Graphing
Students analyze two-way frequency tables in the context of relatable scenarios in this eighth-grade math worksheet!
Worksheet
Interpreting Two-Way Frequency Tables
Worksheet
Interpreting Two-Way Frequency Tables
Students analyze two-way frequency tables in the context of relatable scenarios in this eighth-grade math worksheet!
Eighth Grade
Data and Graphing
Worksheet
1
…
8
9
10
11
12