SKIP TO CONTENT
Worksheet Generator
Subjects
Grades
Worksheets
Games
Build a Worksheet
More Resources
Roly Recommends
Math Month
Subjects
Grades
Worksheets
Games
Build a Worksheet
More Resources
Roly Recommends
Math Month
All Subjects
Math
Data and Graphing
Subtopics:
Collecting and Organizing Data
Picture Graphs
Bar Graphs
Line Plots
Coordinate Plane
Box Plots
Histograms
Show Less
Filters
Search for: synthesizing, information, from, multiple, sources, on, the, same, topic
✕
Math
✕
Subjects
Math
English Language Arts
Science
Social Studies
Foreign Language
Grade Level
Pre-K
K
1st
2nd
3rd
4th
5th
6th
7th
8th
Early Childhood
Elementary School
Middle School
Resource Type
Worksheets
Games
Lesson Plans
Interactive Worksheets
Workbooks
Activities
Exercises
Stories
Songs
Offline Games
Guided Lessons
Occasion
Birthdays
St. Patrick's Day
Summer
Independence Day
Back to School
Halloween
Holidays
Hanukkah
Lunar New Year
Valentine's Day
Common Core
Yes
Game Type
Ball Games
Arts & Crafts
Arts & Crafts
Paper & Glue Crafts
Construction & Sculpture
English Language Support
Yes
See More
Clear All
View 171 results
Showing Results for synthesizing information from multiple sources on the same topic
171 results
Search for: synthesizing, information, from, multiple, sources, on, the, same, topic
✕
Math
✕
Sort by:
Relevance
Most recent
Most popular
Alphabetical A-Z
Alphabetical Z-A
All filters
171 results
Sort by:
Relevance
Most recent
Most popular
Alphabetical A-Z
Alphabetical Z-A
Information Gap Cards: Line Plots
Worksheet
Information Gap Cards: Line Plots
Fifth Grade
Fractions
Students will look at line plots and match information cards with classmates.
Worksheet
Information Gap Cards: Line Plots
Worksheet
Information Gap Cards: Line Plots
Students will look at line plots and match information cards with classmates.
Fifth Grade
Fractions
Worksheet
Same And Different Song
Song
Same And Different Song
Pre-K
Data and Graphing
Sing a sorting song and learn about same and different. In this song, kids pick the item that doesn't belong and figure out exactly what makes it different.
Song
Same And Different Song
Song
Same And Different Song
Sing a sorting song and learn about same and different. In this song, kids pick the item that doesn't belong and figure out exactly what makes it different.
Pre-K
Data and Graphing
Song
Making Sweet Line Graphs!
Worksheet
Making Sweet Line Graphs!
Second Grade
Data and Graphing
Satisfy your sweet tooth, and practice graphing at the same time! Practice making a line graph using the information given.
Worksheet
Making Sweet Line Graphs!
Worksheet
Making Sweet Line Graphs!
Satisfy your sweet tooth, and practice graphing at the same time! Practice making a line graph using the information given.
Second Grade
Data and Graphing
Worksheet
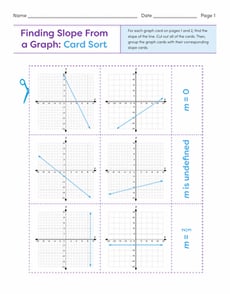
Finding Slope From a Graph: Card Sort
Worksheet
Finding Slope From a Graph: Card Sort
Eighth Grade
Algebra
Use this hands-on card sort activity to give students practice determining slope from a graph!
Worksheet
Finding Slope From a Graph: Card Sort
Worksheet
Finding Slope From a Graph: Card Sort
Use this hands-on card sort activity to give students practice determining slope from a graph!
Eighth Grade
Algebra
Worksheet
Do We Wear the Same Colors?
Activity
Do We Wear the Same Colors?
Third Grade
Data and Graphing
Hone observational skills and introduce the basics of data interpretation with this data gathering activity all about the different colors people wear.
Activity
Do We Wear the Same Colors?
Activity
Do We Wear the Same Colors?
Hone observational skills and introduce the basics of data interpretation with this data gathering activity all about the different colors people wear.
Third Grade
Data and Graphing
Activity
Bar Graphs: School Subjects
Worksheet
Bar Graphs: School Subjects
Second Grade
Data and Graphing
Math students, get ready to graph! Here is a great worksheet that will help your student practice making bar graphs from information provided.
Worksheet
Bar Graphs: School Subjects
Worksheet
Bar Graphs: School Subjects
Math students, get ready to graph! Here is a great worksheet that will help your student practice making bar graphs from information provided.
Second Grade
Data and Graphing
Worksheet
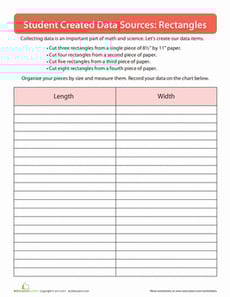
Creating Data
Worksheet
Creating Data
Third Grade
Measurement
Practice creating your own data sources in this introductory graphing activity.
Worksheet
Creating Data
Worksheet
Creating Data
Practice creating your own data sources in this introductory graphing activity.
Third Grade
Measurement
Worksheet
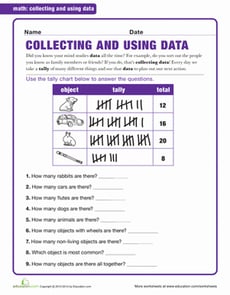
Using Data
Worksheet
Using Data
First Grade
Data and Graphing
This worksheet provides excellent practice adding, interpreting, and organizing information.
Worksheet
Using Data
Worksheet
Using Data
This worksheet provides excellent practice adding, interpreting, and organizing information.
First Grade
Data and Graphing
Worksheet
From Dot Plots to Histograms
Worksheet
From Dot Plots to Histograms
Sixth Grade
Data and Graphing
Discover different ways to display data in this delightful sixth-grade worksheet!
Worksheet
From Dot Plots to Histograms
Worksheet
From Dot Plots to Histograms
Discover different ways to display data in this delightful sixth-grade worksheet!
Sixth Grade
Data and Graphing
Worksheet
Create Histograms From Data Sets
Worksheet
Create Histograms From Data Sets
Sixth Grade
Data and Graphing
Draw data to show a scientist’s findings in this practical worksheet!
Worksheet
Create Histograms From Data Sets
Worksheet
Create Histograms From Data Sets
Draw data to show a scientist’s findings in this practical worksheet!
Sixth Grade
Data and Graphing
Worksheet
Basic Pictographs
Worksheet
Basic Pictographs
First Grade
Data and Graphing
Practice adding multiple digits with a fun pictograph page. Use the chart to draw out the number of items in each problem.
Worksheet
Basic Pictographs
Worksheet
Basic Pictographs
Practice adding multiple digits with a fun pictograph page. Use the chart to draw out the number of items in each problem.
First Grade
Data and Graphing
Worksheet
Eat Healthy Bar Graph
Worksheet
Eat Healthy Bar Graph
Third Grade
Data and Graphing
Use this relevant topic about healthy food to give your students practice reading a bar graph and answering questions about the data.
Worksheet
Eat Healthy Bar Graph
Worksheet
Eat Healthy Bar Graph
Use this relevant topic about healthy food to give your students practice reading a bar graph and answering questions about the data.
Third Grade
Data and Graphing
Worksheet
Addition Picture Graphs
Worksheet
Addition Picture Graphs
First Grade
Data and Graphing
Explore some stellar math concepts with this worksheet on adding multiple digits. Fill in the pictograph to help you visualize the problem first.
Worksheet
Addition Picture Graphs
Worksheet
Addition Picture Graphs
Explore some stellar math concepts with this worksheet on adding multiple digits. Fill in the pictograph to help you visualize the problem first.
First Grade
Data and Graphing
Worksheet
Math + Love = Valentine's Day Bar Graph
Lesson Plan
Math + Love = Valentine's Day Bar Graph
Second Grade
Data and Graphing
What's more romantic than a bar graph on Valentine's Day? In this Valentine's Day lesson plan, students will use information from a data set to create their own tally charts and bar graphs and then analyze these graphs to answer questions.
Lesson Plan
Math + Love = Valentine's Day Bar Graph
Lesson Plan
Math + Love = Valentine's Day Bar Graph
What's more romantic than a bar graph on Valentine's Day? In this Valentine's Day lesson plan, students will use information from a data set to create their own tally charts and bar graphs and then analyze these graphs to answer questions.
Second Grade
Data and Graphing
Lesson Plan
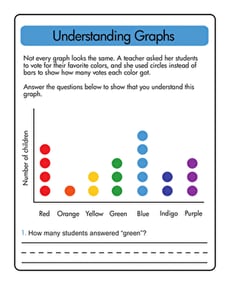
Understanding Graphs
Worksheet
Understanding Graphs
First Grade
Data and Graphing
Test your first grader's understanding of graphs and the information they provide with this worksheet.
Worksheet
Understanding Graphs
Worksheet
Understanding Graphs
Test your first grader's understanding of graphs and the information they provide with this worksheet.
First Grade
Data and Graphing
Worksheet
Creating Histograms From Frequency Tables
Worksheet
Creating Histograms From Frequency Tables
Sixth Grade
Data and Graphing
Practice using histograms to show different sets of data in this engaging sixth-grade worksheet!
Worksheet
Creating Histograms From Frequency Tables
Worksheet
Creating Histograms From Frequency Tables
Practice using histograms to show different sets of data in this engaging sixth-grade worksheet!
Sixth Grade
Data and Graphing
Worksheet
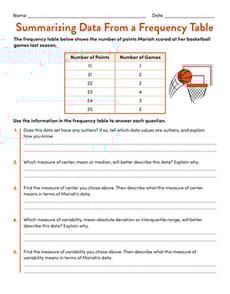
Summarizing Data From a Frequency Table
Worksheet
Summarizing Data From a Frequency Table
Sixth Grade
Data and Graphing
Practice summarizing a numerical data set with this one-page statistics worksheet!
Worksheet
Summarizing Data From a Frequency Table
Worksheet
Summarizing Data From a Frequency Table
Practice summarizing a numerical data set with this one-page statistics worksheet!
Sixth Grade
Data and Graphing
Worksheet
Graph the Critters
Worksheet
Graph the Critters
Second Grade
Data and Graphing
Give your second grader a fun way to practice basic arithmetic, and to practice making a graph with given information.
Worksheet
Graph the Critters
Worksheet
Graph the Critters
Give your second grader a fun way to practice basic arithmetic, and to practice making a graph with given information.
Second Grade
Data and Graphing
Worksheet
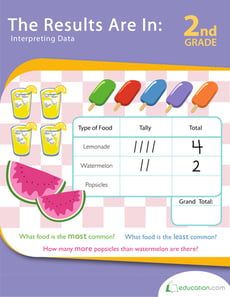
The Results Are In: Interpreting Data
Workbook
The Results Are In: Interpreting Data
Second Grade
Data and Graphing
Pictures and information go hand-in-hand in this workbook. Take a bite out of simple graphing and savor the math!
Workbook
The Results Are In: Interpreting Data
Workbook
The Results Are In: Interpreting Data
Pictures and information go hand-in-hand in this workbook. Take a bite out of simple graphing and savor the math!
Second Grade
Data and Graphing
Workbook
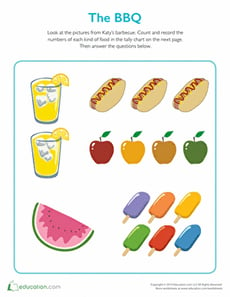
The BBQ Tally
Worksheet
The BBQ Tally
Second Grade
Data and Graphing
Your student will use the colorful pictures to count the number of food items that were consumed and record the information using the tally chart provided.
Worksheet
The BBQ Tally
Worksheet
The BBQ Tally
Your student will use the colorful pictures to count the number of food items that were consumed and record the information using the tally chart provided.
Second Grade
Data and Graphing
Worksheet
Reading Pictographs: Building a New Town
Worksheet
Reading Pictographs: Building a New Town
Third Grade
Data and Graphing
In this 3rd grade math worksheet, kids practice interpreting graph data and using information in a pictograph to answer word problems.
Worksheet
Reading Pictographs: Building a New Town
Worksheet
Reading Pictographs: Building a New Town
In this 3rd grade math worksheet, kids practice interpreting graph data and using information in a pictograph to answer word problems.
Third Grade
Data and Graphing
Worksheet
Jake's Nature Hike
Worksheet
Jake's Nature Hike
Second Grade
Data and Graphing
How many animals have you seen on your hikes? Jake saw many animals on his! Create your own bar graph with the information given.
Worksheet
Jake's Nature Hike
Worksheet
Jake's Nature Hike
How many animals have you seen on your hikes? Jake saw many animals on his! Create your own bar graph with the information given.
Second Grade
Data and Graphing
Worksheet
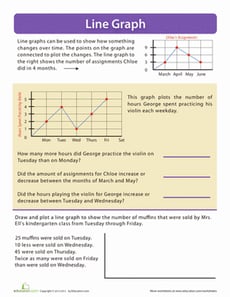
Line Graph
Worksheet
Line Graph
Third Grade
Data and Graphing
Introduce your math whiz to line graphs with this comprehensive lesson. Kids will read information on a line graph and plot some data as well.
Worksheet
Line Graph
Worksheet
Line Graph
Introduce your math whiz to line graphs with this comprehensive lesson. Kids will read information on a line graph and plot some data as well.
Third Grade
Data and Graphing
Worksheet
Reading Pictographs: Carrots for Bunnies
Worksheet
Reading Pictographs: Carrots for Bunnies
Third Grade
Data and Graphing
How many carrots did Sammy's pet bunny eat? Kids use information in the pictograph to answer word problems in this bunny-filled math worksheet.
Worksheet
Reading Pictographs: Carrots for Bunnies
Worksheet
Reading Pictographs: Carrots for Bunnies
How many carrots did Sammy's pet bunny eat? Kids use information in the pictograph to answer word problems in this bunny-filled math worksheet.
Third Grade
Data and Graphing
Worksheet
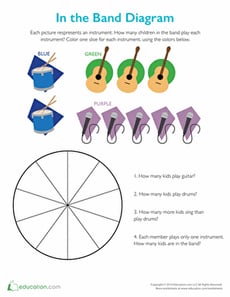
In the Band Pie Graph
Worksheet
In the Band Pie Graph
Second Grade
Data and Graphing
Rock out with this pie chart! Enjoy learning how to make a pie graph and interpret data while answering questions based on the information given.
Worksheet
In the Band Pie Graph
Worksheet
In the Band Pie Graph
Rock out with this pie chart! Enjoy learning how to make a pie graph and interpret data while answering questions based on the information given.
Second Grade
Data and Graphing
Worksheet
Make Predictions Using Experimental Probability
Interactive Worksheet
Make Predictions Using Experimental Probability
Seventh Grade
Data and Graphing
In this seventh-grade probability worksheet, students are introduced to the concept of experimental probability and shown how to use this information to make predictions.
Interactive Worksheet
Make Predictions Using Experimental Probability
Interactive Worksheet
Make Predictions Using Experimental Probability
In this seventh-grade probability worksheet, students are introduced to the concept of experimental probability and shown how to use this information to make predictions.
Seventh Grade
Data and Graphing
Interactive Worksheet
Reading Pictographs: Going to the Theater
Worksheet
Reading Pictographs: Going to the Theater
Third Grade
Data and Graphing
In this 3rd grade math worksheet, kids practice interpreting graph data as they use the information in a pictograph to answer a set of questions.
Worksheet
Reading Pictographs: Going to the Theater
Worksheet
Reading Pictographs: Going to the Theater
In this 3rd grade math worksheet, kids practice interpreting graph data as they use the information in a pictograph to answer a set of questions.
Third Grade
Data and Graphing
Worksheet
Hiking Buddies Pictograph
Worksheet
Hiking Buddies Pictograph
Second Grade
Data and Graphing
This pictograph shows how many hikes Eric and his friends went on this month. Use the information to answer questions and determine who hiked the most.
Worksheet
Hiking Buddies Pictograph
Worksheet
Hiking Buddies Pictograph
This pictograph shows how many hikes Eric and his friends went on this month. Use the information to answer questions and determine who hiked the most.
Second Grade
Data and Graphing
Worksheet
Juice Time: Practice Reading a Bar Graph
Worksheet
Juice Time: Practice Reading a Bar Graph
Third Grade
Data and Graphing
In this 3rd grade math worksheet, your child will practice reading a bar graph about juice and interpreting its information to answer a set of questions.
Worksheet
Juice Time: Practice Reading a Bar Graph
Worksheet
Juice Time: Practice Reading a Bar Graph
In this 3rd grade math worksheet, your child will practice reading a bar graph about juice and interpreting its information to answer a set of questions.
Third Grade
Data and Graphing
Worksheet
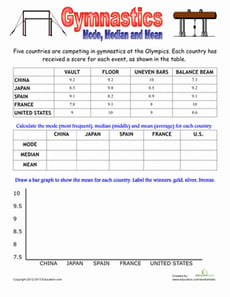
Olympic Math: Gymnastics
Worksheet
Olympic Math: Gymnastics
Fifth Grade
Data and Graphing
Flip your way to finding the mean, median and mode of these Olympic scores! Practice basic data analysis, and then put the information in a bar graph.
Worksheet
Olympic Math: Gymnastics
Worksheet
Olympic Math: Gymnastics
Flip your way to finding the mean, median and mode of these Olympic scores! Practice basic data analysis, and then put the information in a bar graph.
Fifth Grade
Data and Graphing
Worksheet
1
2
3
4
5
6