SKIP TO CONTENT
Worksheet Generator
Subjects
Grades
Worksheets
Games
Build a Worksheet
More Resources
Roly Recommends
Subjects
Grades
Worksheets
Games
Build a Worksheet
More Resources
Roly Recommends
All Subjects
Math
Data and Graphing
Subtopics:
Collecting and Organizing Data
✕
Picture Graphs
Bar Graphs
Line Plots
Coordinate Plane
Box Plots
Histograms
Scatter Plots
Show Less
Filters
Search for: article, creating, environments, discovery, learning
✕
Math
✕
Common Core
✕
Subjects
Math
English Language Arts
Science
Social Studies
Foreign Language
Grade Level
Pre-K
K
1st
2nd
3rd
4th
5th
6th
7th
8th
Early Childhood
Elementary School
Middle School
Resource Type
Worksheets
Games
Lesson Plans
Interactive Worksheets
Activities
Common Core
Yes
English Language Support
Yes
See More
Clear All
View 11 results
Showing Results for article creating environments discovery learning
11 results
Search for: article, creating, environments, discovery, learning
✕
Math
✕
Common Core
✕
Clear All
Sort by:
Relevance
Most recent
Most popular
Alphabetical A-Z
Alphabetical Z-A
All filters
11 results
Sort by:
Relevance
Most recent
Most popular
Alphabetical A-Z
Alphabetical Z-A
Line Plot Practice
Worksheet
Line Plot Practice
Second Grade
Data and Graphing
Use this worksheet to get your mathematicians comfortable and confident creating and interpreting line plots from a given set of data.
Worksheet
Line Plot Practice
Worksheet
Line Plot Practice
Use this worksheet to get your mathematicians comfortable and confident creating and interpreting line plots from a given set of data.
Second Grade
Data and Graphing
Worksheet
Constructing Two-Way Relative Frequency Tables
Interactive Worksheet
Constructing Two-Way Relative Frequency Tables
Eighth Grade
Data and Graphing
Practice creating two-way relative frequency tables based on real-world scenarios with this eighth-grade math worksheet!
Interactive Worksheet
Constructing Two-Way Relative Frequency Tables
Interactive Worksheet
Constructing Two-Way Relative Frequency Tables
Practice creating two-way relative frequency tables based on real-world scenarios with this eighth-grade math worksheet!
Eighth Grade
Data and Graphing
Interactive Worksheet
Backyard Bugs
Activity
Backyard Bugs
First Grade
Data and Graphing
Want to boost math and science learning? Take a bug expedition and give your first grader practice observing and charting what they see.
Activity
Backyard Bugs
Activity
Backyard Bugs
Want to boost math and science learning? Take a bug expedition and give your first grader practice observing and charting what they see.
First Grade
Data and Graphing
Activity
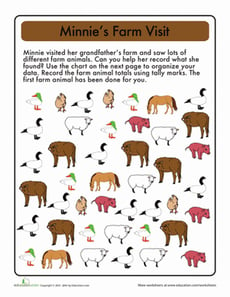
Tally Time: On the Farm
Worksheet
Tally Time: On the Farm
First Grade
Data and Graphing
Kids help Minnie figure out how many pigs, sheep, and other animals live on the farm by reading the tables and counting up the tally marks.
Worksheet
Tally Time: On the Farm
Worksheet
Tally Time: On the Farm
Kids help Minnie figure out how many pigs, sheep, and other animals live on the farm by reading the tables and counting up the tally marks.
First Grade
Data and Graphing
Worksheet
Seasons Suitcase Sort
Game
Seasons Suitcase Sort
Kindergarten
Data and Graphing
Kids sort winter and summer clothes in this cute categorization game.
Game
Seasons Suitcase Sort
Game
Seasons Suitcase Sort
Kids sort winter and summer clothes in this cute categorization game.
Kindergarten
Data and Graphing
Game
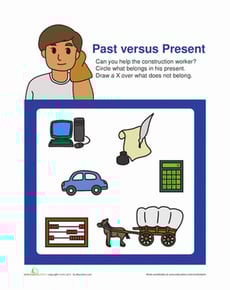
Past vs Present
Worksheet
Past vs Present
Kindergarten
Data and Graphing
Explore the concept of time with your little learner. Which of these items are from the present day? Which are from the past?
Worksheet
Past vs Present
Worksheet
Past vs Present
Explore the concept of time with your little learner. Which of these items are from the present day? Which are from the past?
Kindergarten
Data and Graphing
Worksheet
Sort 2D and 3D Shapes
Interactive Worksheet
Sort 2D and 3D Shapes
Kindergarten
Geometry
Can your kid tell the difference between 2-dimensional and 3-dimensional shapes? Kindergarten is a good time to start!
Interactive Worksheet
Sort 2D and 3D Shapes
Interactive Worksheet
Sort 2D and 3D Shapes
Can your kid tell the difference between 2-dimensional and 3-dimensional shapes? Kindergarten is a good time to start!
Kindergarten
Geometry
Interactive Worksheet
Tally Time: At the Farmers Market
Worksheet
Tally Time: At the Farmers Market
First Grade
Data and Graphing
The farmer needs help keeping track of his vegetables. Can your child use her counting skills to give him a hand?
Worksheet
Tally Time: At the Farmers Market
Worksheet
Tally Time: At the Farmers Market
The farmer needs help keeping track of his vegetables. Can your child use her counting skills to give him a hand?
First Grade
Data and Graphing
Worksheet
Bar Graphs: Interpreting Data
Lesson Plan
Bar Graphs: Interpreting Data
Second Grade
Data and Graphing
In this lesson, students will make bar graphs and interpret data using real-life data from other students. They will get practice writing and answering survey questions.
Lesson Plan
Bar Graphs: Interpreting Data
Lesson Plan
Bar Graphs: Interpreting Data
In this lesson, students will make bar graphs and interpret data using real-life data from other students. They will get practice writing and answering survey questions.
Second Grade
Data and Graphing
Lesson Plan
Why Do Leaves Change Color?
Activity
Why Do Leaves Change Color?
Second Grade
Data and Graphing
Engage your children with this fun fall activity that integrates math and science. First, your child will excavate to find leaves. Next, they'll examine them to determine the colors. Then, your child will graph their findings.
Activity
Why Do Leaves Change Color?
Activity
Why Do Leaves Change Color?
Engage your children with this fun fall activity that integrates math and science. First, your child will excavate to find leaves. Next, they'll examine them to determine the colors. Then, your child will graph their findings.
Second Grade
Data and Graphing
Activity
Math + Love = Valentine's Day Bar Graph
Lesson Plan
Math + Love = Valentine's Day Bar Graph
Second Grade
Data and Graphing
What's more romantic than a bar graph on Valentine's Day? In this Valentine's Day lesson plan, students will use information from a data set to create their own tally charts and bar graphs and then analyze these graphs to answer questions.
Lesson Plan
Math + Love = Valentine's Day Bar Graph
Lesson Plan
Math + Love = Valentine's Day Bar Graph
What's more romantic than a bar graph on Valentine's Day? In this Valentine's Day lesson plan, students will use information from a data set to create their own tally charts and bar graphs and then analyze these graphs to answer questions.
Second Grade
Data and Graphing
Lesson Plan
1