Picture Graphs Resources
86 results
Math
✕86 results
Picture Graphs Resources
86 results
Math
✕86 results


About Picture Graphs Resources
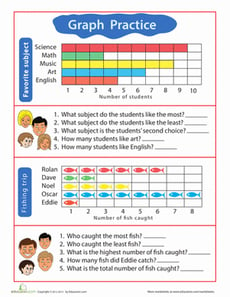
On Education.com, this page provides coloring pages and classroom activities to help young learners understand picture graphs. These resources introduce students to displaying data visually using images and symbols, making it easier to compare quantities and recognize patterns. Educators and parents can access printable worksheets that guide children through creating, interpreting, and analyzing picture graphs in engaging ways.
This section features interactive lessons, printable practice sheets, and visual charts designed for elementary students. These materials encourage hands-on learning and critical thinking while helping learners grasp data representation. The resources are especially useful for early math lessons, classroom practice, or independent learning at home.
Educators and parents can use these picture graphs resources to save preparation time while providing structured practice in data visualization. Each page promotes practical math skills, reinforces concepts of comparison and categorization, and supports foundational arithmetic learning. These materials make data analysis accessible and fun for young students.