3rd Grade Data and Graphing Resources


About 3rd Grade Data And Graphing Resources
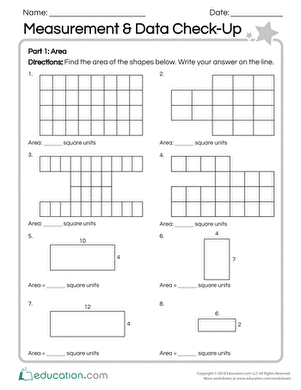
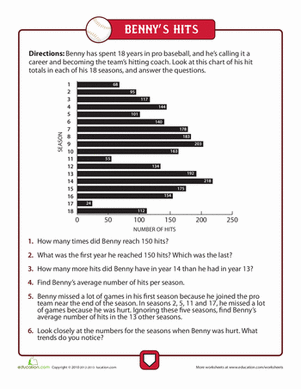
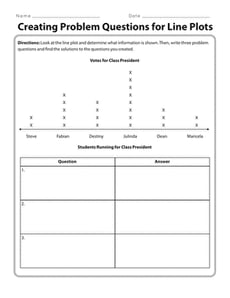
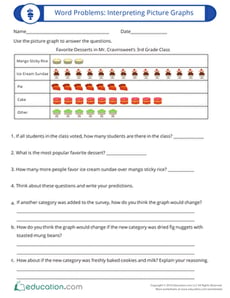
On Education.com, explore a variety of 3rd grade data and graphing resources designed to help students interpret information and create accurate visual representations. These include worksheets, printable activities, and interactive lessons that teach students to categorize data, design charts and graphs, and analyze trends. The materials are designed to make learning about data collection and visualization engaging and accessible for young learners.
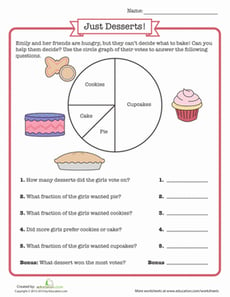
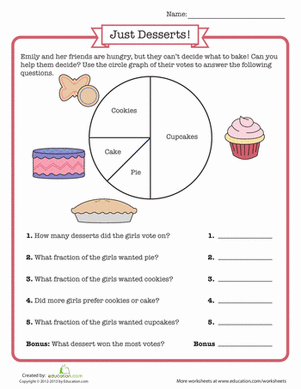
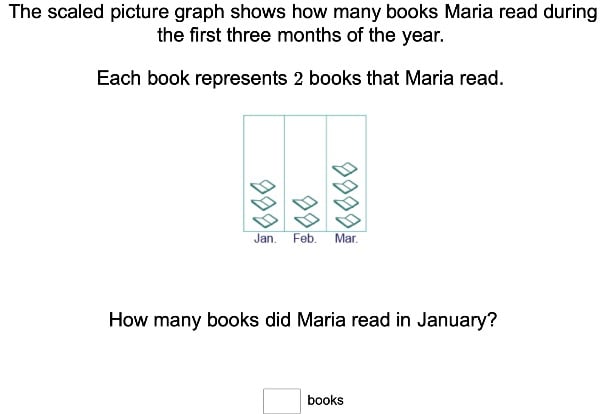
Education.com provides a range of resources and printable pages that introduce children to concepts such as bar graphs, pie charts, line graphs, and pictographs. These materials help students practice organizing data, reading charts, and drawing conclusions from visual information. Educators and parents can use these resources to reinforce mathematical skills, enhance problem-solving abilities, and build a foundation in data literacy.
Using these data and graphing resources, teachers and parents can provide structured yet fun opportunities for children to apply math skills in real-world contexts. Children can analyze classroom survey results, track weather patterns, or graph their savings. This makes abstract concepts more tangible and helps students develop critical thinking skills while participating in active, hands-on learning.