3rd Grade Common Core Line Plots Resources
Common Core Quick Links:
Common Core Standards for 3rd Grade Math, Common Core Standards for 3rd Grade ELA


About 3rd Grade Common Core Line Plots Resources
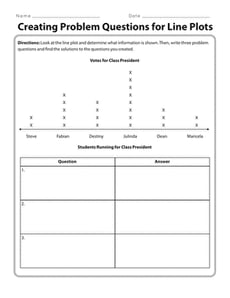
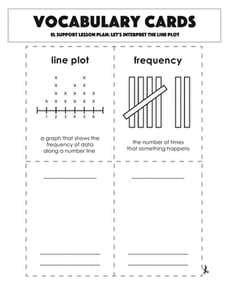
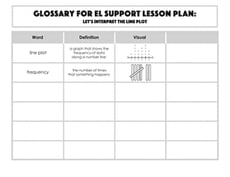
On Education.com, 3rd-grade Common Core line plots resources provide students with practice in creating and interpreting bar graphs that display data. These materials help teach students to organize data visually, understand measurement scales, and analyze frequency in a classroom or at home. The page offers printable worksheets, exercises, and interactive activities structured around collecting, arranging, and reading data on line plots, making data literacy accessible and engaging for young learners.
This page on Education.com features various 3rd-grade line plot worksheets, including blank graph charts, data collection exercises, and charts based on classroom or real-world examples. These hands-on teaching tools provide clear instructions and visuals for students to successfully plot and read data. Educators and parents can use these materials to support instruction in mathematics, data analysis, and critical reasoning in integrative lessons that encourage practical application.
Educators can utilize these worksheets to assess students’ understanding of data representation, while parents can reinforce classroom learning at home. The structured exercises make it easy to guide students through hands-on plotting and analysis steps. Using these resources promotes visual learning, supports comprehension of numerical data, and fosters analytical thinking through practical graphing activities. All materials are designed to enhance understanding while making math demonstrations fun and engaging.