Picture Graphs Workbooks
About Picture Graphs Workbooks
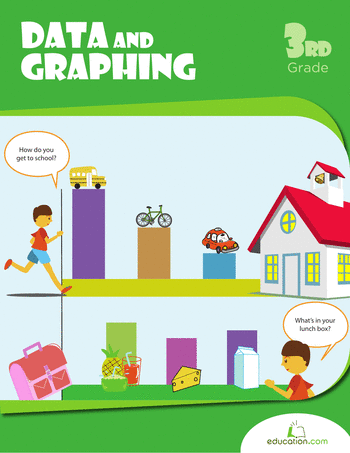
On Education.com, picture graphs workbooks provide hands-on materials that help young learners develop data interpretation and representation skills. These worksheets guide children through creating bar graphs and pictograms using real-world objects, making abstract math concepts more accessible and engaging. By practicing with structured exercises, students strengthen their ability to collect, organize, and analyze data in a visual format.
Explore a variety of printable activities and lesson plans designed to teach children about graphing using pictures. These resources include blank templates for sketches, guided exercises on reading and creating data visualizations, and practical examples that connect learning to everyday experiences. Structured pages support educators and parents in sequencing lessons that build foundational math and critical thinking skills.
Use picture graphs workbooks to enhance classroom instruction or provide structured practice at home. Students can learn to organize information accurately, compare data sets, and communicate findings visually. These materials save teachers and parents time by offering ready-to-use worksheets that reinforce data collection, observation, and graphical skills in a fun, educational format.


