SKIP TO CONTENT
Worksheet Generator
Subjects
Grades
Worksheets
Games
Build a Worksheet
More Resources
Roly Recommends
Summer Boost
Subjects
Grades
Worksheets
Games
Build a Worksheet
More Resources
Roly Recommends
Summer Boost
Showing Results for graphing data : Page 5
Filters
414 results
Search for: graphing, data
✕
Worksheets
✕
Clear All
414 results
Filters
Search for: graphing, data
✕
Worksheets
✕
Subjects
Math
English Language Arts
Science
Social Studies
Grade Level
Pre-K
K
1st
2nd
3rd
4th
5th
6th
7th
8th
Early Childhood
Elementary School
Middle School
Resource Type
Worksheets
Games
Lesson Plans
Interactive Worksheets
Workbooks
Activities
Exercises
Songs
Offline Games
Guided Lessons
Teacher Resources
Occasion
Spring
Easter
Summer
Back to School
Fall
Halloween
Winter
Holidays
Christmas
Valentine's Day
See more
Common Core
Yes
No
Game Type
Mazes
Printable Board Games
Puzzles & Sudoku
See More
Clear All
View 414 results
Showing Results for graphing data : Page 5
Filters
414 results
Search for: graphing, data
✕
Worksheets
✕
Clear All
414 results
Graph It! Blank Graph Paper
Worksheet
Graph It! Blank Graph Paper
Third Grade
Our convenient, printable graph paper offers a versatile, orderly space to solve problems, sort data, and to create plots, charts, and graphs.
Worksheet
Graph It! Blank Graph Paper
Worksheet
Graph It! Blank Graph Paper
Our convenient, printable graph paper offers a versatile, orderly space to solve problems, sort data, and to create plots, charts, and graphs.
Third Grade
Worksheet
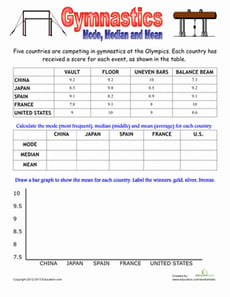
Olympic Math: Gymnastics
Worksheet
Olympic Math: Gymnastics
Fifth Grade
Data and Graphing
Flip your way to finding the mean, median and mode of these Olympic scores! Practice basic data analysis, and then put the information in a bar graph.
Worksheet
Olympic Math: Gymnastics
Worksheet
Olympic Math: Gymnastics
Flip your way to finding the mean, median and mode of these Olympic scores! Practice basic data analysis, and then put the information in a bar graph.
Fifth Grade
Data and Graphing
Worksheet
Design an Experiment Part 3: Draw a Conclusion
Worksheet
Design an Experiment Part 3: Draw a Conclusion
Sixth Grade
Engineering and Science Inquiry
With your experiment data and analysis in hand, it’s time to draw your conclusions!
Worksheet
Design an Experiment Part 3: Draw a Conclusion
Worksheet
Design an Experiment Part 3: Draw a Conclusion
With your experiment data and analysis in hand, it’s time to draw your conclusions!
Sixth Grade
Engineering and Science Inquiry
Worksheet
Do a Survey! Favorite Veggies
Worksheet
Do a Survey! Favorite Veggies
Second Grade
Data and Graphing
Give your second grader some practice working with data with this fun-to-complete favorite veggie survey.
Worksheet
Do a Survey! Favorite Veggies
Worksheet
Do a Survey! Favorite Veggies
Give your second grader some practice working with data with this fun-to-complete favorite veggie survey.
Second Grade
Data and Graphing
Worksheet
Picnic Bar Graph
Worksheet
Picnic Bar Graph
Second Grade
Data and Graphing
Which picnic games do you prefer? This bar graph shows some of the most popular picnic activities. Students will learn about analyzing data from a bar graph.
Worksheet
Picnic Bar Graph
Worksheet
Picnic Bar Graph
Which picnic games do you prefer? This bar graph shows some of the most popular picnic activities. Students will learn about analyzing data from a bar graph.
Second Grade
Data and Graphing
Worksheet
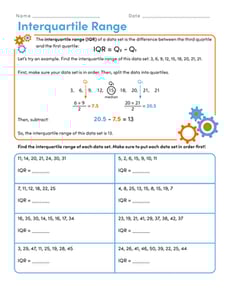
Interquartile Range
Interactive Worksheet
Interquartile Range
Sixth Grade
Statistics
In this sixth-grade statistics worksheet, students will practice finding the interquartile range of data sets.
Interactive Worksheet
Interquartile Range
Interactive Worksheet
Interquartile Range
In this sixth-grade statistics worksheet, students will practice finding the interquartile range of data sets.
Sixth Grade
Statistics
Interactive Worksheet
Dot Plots
Worksheet
Dot Plots
Sixth Grade
Data and Graphing
Covering a variety of interesting real-life contexts, this two-page math worksheet gives learners practice turning data sets into dot plots that are representative of each scenario.
Worksheet
Dot Plots
Worksheet
Dot Plots
Covering a variety of interesting real-life contexts, this two-page math worksheet gives learners practice turning data sets into dot plots that are representative of each scenario.
Sixth Grade
Data and Graphing
Worksheet
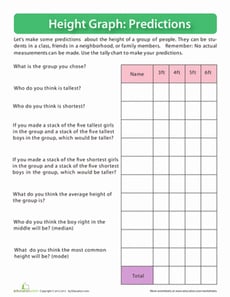
Height Graph
Worksheet
Height Graph
Third Grade
How tall do you think your friends or classmates are? Practice making predictions with this graphing exercise.
Worksheet
Height Graph
Worksheet
Height Graph
How tall do you think your friends or classmates are? Practice making predictions with this graphing exercise.
Third Grade
Worksheet
Creating Box Plots
Worksheet
Creating Box Plots
Sixth Grade
Data and Graphing
Learn to draw your own box plots to show data in this informative sixth-grade worksheet!
Worksheet
Creating Box Plots
Worksheet
Creating Box Plots
Learn to draw your own box plots to show data in this informative sixth-grade worksheet!
Sixth Grade
Data and Graphing
Worksheet
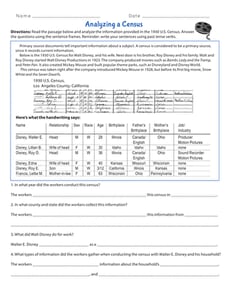
Analyzing a Census
Worksheet
Analyzing a Census
Fourth Grade
Reading
It’s census time! Travel back to 1930 to analyze the census data for the household of Walt Disney.
Worksheet
Analyzing a Census
Worksheet
Analyzing a Census
It’s census time! Travel back to 1930 to analyze the census data for the household of Walt Disney.
Fourth Grade
Reading
Worksheet
Practice Graphs
Worksheet
Practice Graphs
Second Grade
Data and Graphing
Kids practice representing a set of data using three kinds of graphs: a bar graph, pictograph, and pie graph.
Worksheet
Practice Graphs
Worksheet
Practice Graphs
Kids practice representing a set of data using three kinds of graphs: a bar graph, pictograph, and pie graph.
Second Grade
Data and Graphing
Worksheet
Olympic Math: High Jump
Worksheet
Olympic Math: High Jump
Fifth Grade
Data and Graphing
Jump over the hurdles of math by learning mode, median and mean. Use knowledge of data analysis to put each country's scores in a graph and award the winners!
Worksheet
Olympic Math: High Jump
Worksheet
Olympic Math: High Jump
Jump over the hurdles of math by learning mode, median and mean. Use knowledge of data analysis to put each country's scores in a graph and award the winners!
Fifth Grade
Data and Graphing
Worksheet
Using a Chart: Do Your Chores!
Worksheet
Using a Chart: Do Your Chores!
Third Grade
Data and Graphing
Kids completing this third grade math worksheet use a chart to compare data and solve addition problems.
Worksheet
Using a Chart: Do Your Chores!
Worksheet
Using a Chart: Do Your Chores!
Kids completing this third grade math worksheet use a chart to compare data and solve addition problems.
Third Grade
Data and Graphing
Worksheet
How Do You Measure Up?
Worksheet
How Do You Measure Up?
Fifth Grade
Fractions
Students will take practice measurements of real world objects and make a line plot of the data.
Worksheet
How Do You Measure Up?
Worksheet
How Do You Measure Up?
Students will take practice measurements of real world objects and make a line plot of the data.
Fifth Grade
Fractions
Worksheet
Medal Tally and Graph
Worksheet
Medal Tally and Graph
Second Grade
Have your child keep track of different countries' medals with this printable table and graphing worksheet.
Worksheet
Medal Tally and Graph
Worksheet
Medal Tally and Graph
Have your child keep track of different countries' medals with this printable table and graphing worksheet.
Second Grade
Worksheet
Record Your Fall Favorites
Worksheet
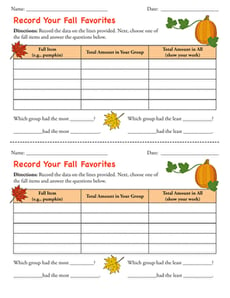
Record Your Fall Favorites
Second Grade
Data and Graphing
Use this template alongside the engaging lesson, “Let’s Graph Our Fall Favorites” to support kids in interpreting data.
Worksheet
Record Your Fall Favorites
Worksheet
Record Your Fall Favorites
Use this template alongside the engaging lesson, “Let’s Graph Our Fall Favorites” to support kids in interpreting data.
Second Grade
Data and Graphing
Worksheet
Bar Graphs
Worksheet
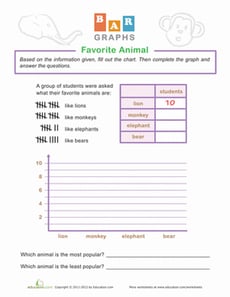
Bar Graphs
Second Grade
Data and Graphing
What is the class's favorite animal? Get your student ready for graphing with this fun bar graph worksheet!
Worksheet
Bar Graphs
Worksheet
Bar Graphs
What is the class's favorite animal? Get your student ready for graphing with this fun bar graph worksheet!
Second Grade
Data and Graphing
Worksheet
Picture Graphs
Worksheet
Picture Graphs
First Grade
Data and Graphing
How much school supplies are there in all? Practice drawing data onto a pictograph with this counting and adding worksheet.
Worksheet
Picture Graphs
Worksheet
Picture Graphs
How much school supplies are there in all? Practice drawing data onto a pictograph with this counting and adding worksheet.
First Grade
Data and Graphing
Worksheet
Mystery Picture Graph: Night Scene
Worksheet
Mystery Picture Graph: Night Scene
Fifth Grade
Geometry
Plot the coordinates on the grid to reveal a mystery picture in this two-page graphing worksheet!
Worksheet
Mystery Picture Graph: Night Scene
Worksheet
Mystery Picture Graph: Night Scene
Plot the coordinates on the grid to reveal a mystery picture in this two-page graphing worksheet!
Fifth Grade
Geometry
Worksheet
Peachy Line Plots
Worksheet
Peachy Line Plots
Fifth Grade
Fractions
Students create their own peachy word problems by filling in the blanks, then create a line plot with the data.
Worksheet
Peachy Line Plots
Worksheet
Peachy Line Plots
Students create their own peachy word problems by filling in the blanks, then create a line plot with the data.
Fifth Grade
Fractions
Worksheet
0.5 Centimeter Graph Paper
Worksheet
0.5 Centimeter Graph Paper
Math
Use this worksheet for shapes, multiplication, or graphing coordinates.
Worksheet
0.5 Centimeter Graph Paper
Worksheet
0.5 Centimeter Graph Paper
Use this worksheet for shapes, multiplication, or graphing coordinates.
Math
Worksheet
Mean, Median, and Mode
Interactive Worksheet
Mean, Median, and Mode
Sixth Grade
Statistics
Give students an introduction to the mean, median, and mode of various data sets with this sixth- and seventh-grade math worksheet.
Interactive Worksheet
Mean, Median, and Mode
Interactive Worksheet
Mean, Median, and Mode
Give students an introduction to the mean, median, and mode of various data sets with this sixth- and seventh-grade math worksheet.
Sixth Grade
Statistics
Interactive Worksheet
Bar Graphs: Favorite Season
Worksheet
Bar Graphs: Favorite Season
Second Grade
Data and Graphing
Which season of the year is the best? Get your student ready for graphing with this fun bar graph worksheet!
Worksheet
Bar Graphs: Favorite Season
Worksheet
Bar Graphs: Favorite Season
Which season of the year is the best? Get your student ready for graphing with this fun bar graph worksheet!
Second Grade
Data and Graphing
Worksheet
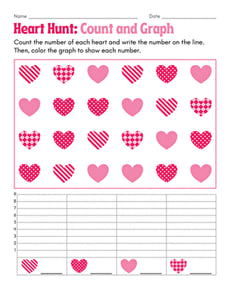
Heart Hunt: Count and Graph
Worksheet
Heart Hunt: Count and Graph
Kindergarten
Numbers and Counting
Hunt for decorative hearts in this Valentine’s Day-themed graphing worksheet for kindergarteners and first graders!
Worksheet
Heart Hunt: Count and Graph
Worksheet
Heart Hunt: Count and Graph
Hunt for decorative hearts in this Valentine’s Day-themed graphing worksheet for kindergarteners and first graders!
Kindergarten
Numbers and Counting
Worksheet
Foot Length: Create a Line Plot with Fractional Units
Worksheet
Foot Length: Create a Line Plot with Fractional Units
Fourth Grade
Data and Graphing
This worksheet challenges third graders to interpret the data and create a line plot with fractions, a key skill for fourth grade math.
Worksheet
Foot Length: Create a Line Plot with Fractional Units
Worksheet
Foot Length: Create a Line Plot with Fractional Units
This worksheet challenges third graders to interpret the data and create a line plot with fractions, a key skill for fourth grade math.
Fourth Grade
Data and Graphing
Worksheet
It's Freezing! Practice Finding Mode
Worksheet
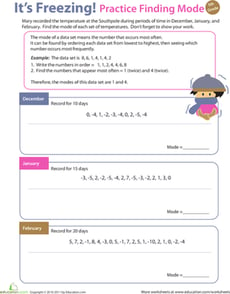
It's Freezing! Practice Finding Mode
Fifth Grade
Measurement
This colorful worksheet will get your fifth grader practicing with mode: the number in a set of data that occurs most often.
Worksheet
It's Freezing! Practice Finding Mode
Worksheet
It's Freezing! Practice Finding Mode
This colorful worksheet will get your fifth grader practicing with mode: the number in a set of data that occurs most often.
Fifth Grade
Measurement
Worksheet
Count the Apples & Make a Graph
Worksheet
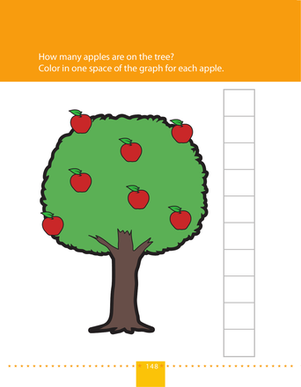
Count the Apples & Make a Graph
Pre-K
Numbers and Counting
On this prekindergarten math worksheet, kids count the apples they see in the picture and record the data in a graph.
Worksheet
Count the Apples & Make a Graph
Worksheet
Count the Apples & Make a Graph
On this prekindergarten math worksheet, kids count the apples they see in the picture and record the data in a graph.
Pre-K
Numbers and Counting
Worksheet
Garden Graphing: Count and Color!
Worksheet
Garden Graphing: Count and Color!
First Grade
Data and Graphing
Carrots, turnips and potatoes, oh my! Count how many of each vegetable our furry farmer picked and then fill in the graph for each vegetable.
Worksheet
Garden Graphing: Count and Color!
Worksheet
Garden Graphing: Count and Color!
Carrots, turnips and potatoes, oh my! Count how many of each vegetable our furry farmer picked and then fill in the graph for each vegetable.
First Grade
Data and Graphing
Worksheet
Line Plot Practice
Worksheet
Line Plot Practice
Second Grade
Data and Graphing
Use this worksheet to get your mathematicians comfortable and confident creating and interpreting line plots from a given set of data.
Worksheet
Line Plot Practice
Worksheet
Line Plot Practice
Use this worksheet to get your mathematicians comfortable and confident creating and interpreting line plots from a given set of data.
Second Grade
Data and Graphing
Worksheet
Pet Survey
Worksheet
Pet Survey
First Grade
Data and Graphing
Have your students survey one another about pet preferences using this interactive activity designed to practice representing and interpreting data.
Worksheet
Pet Survey
Worksheet
Pet Survey
Have your students survey one another about pet preferences using this interactive activity designed to practice representing and interpreting data.
First Grade
Data and Graphing
Worksheet
1
…
4
5
6
…
14