SKIP TO CONTENT
Worksheet Generator
Subjects
Grades
Worksheets
Games
Build a Worksheet
More Resources
Roly Recommends
Subjects
Grades
Worksheets
Games
Build a Worksheet
More Resources
Roly Recommends
Showing Results for and statistics
Filters
Math
Data and Graphing
27 results
Search for: and, statistics
✕
Math
✕
Worksheets
✕
Common Core
✕
Clear all
27 results
Subtopics:
Collecting and Organizing Data
Picture Graphs
Bar Graphs
Line Plots
Box Plots
Histograms
Scatter Plots
Show Less
Filters
Search for: and, statistics
✕
Math
✕
Worksheets
✕
Common Core
✕
Subjects
Math
Science
Grade Level
Pre-K
K
1st
2nd
3rd
4th
5th
6th
7th
8th
Early Childhood
Elementary School
Middle School
Resource Type
Worksheets
Games
Lesson Plans
Interactive Worksheets
Common Core
Yes
Clear all
View 27 results
Showing Results for and statistics
Filters
27 results
Search for: and, statistics
✕
Math
✕
Worksheets
✕
Common Core
✕
Clear all
27 results
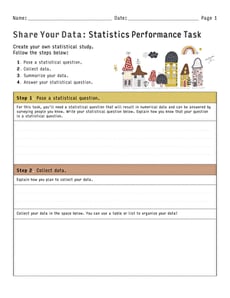
Share Your Data: Statistics Performance Task
Worksheet
Share Your Data: Statistics Performance Task
Sixth Grade
Data and Graphing
Create your own statistical study with this open-ended math worksheet for sixth graders!
Worksheet
Share Your Data: Statistics Performance Task
Worksheet
Share Your Data: Statistics Performance Task
Create your own statistical study with this open-ended math worksheet for sixth graders!
Sixth Grade
Data and Graphing
Worksheet
Describing Distributions in Dot Plots
Worksheet
Describing Distributions in Dot Plots
Sixth Grade
Data and Graphing
Students explore distributions in dot plots with this sixth-grade statistics worksheet!
Worksheet
Describing Distributions in Dot Plots
Worksheet
Describing Distributions in Dot Plots
Students explore distributions in dot plots with this sixth-grade statistics worksheet!
Sixth Grade
Data and Graphing
Worksheet
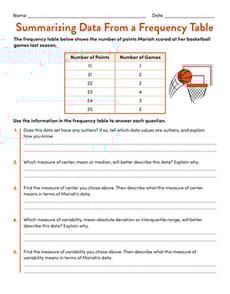
Summarizing Data From a Frequency Table
Worksheet
Summarizing Data From a Frequency Table
Sixth Grade
Data and Graphing
Practice summarizing a numerical data set with this one-page statistics worksheet!
Worksheet
Summarizing Data From a Frequency Table
Worksheet
Summarizing Data From a Frequency Table
Practice summarizing a numerical data set with this one-page statistics worksheet!
Sixth Grade
Data and Graphing
Worksheet
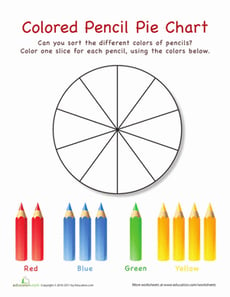
Pie Chart Practice: Colored Pencils
Worksheet
Pie Chart Practice: Colored Pencils
Second Grade
Data and Graphing
Your child might not be ready for statistics, but they can practice using pie charts with this fun, cute worksheet.
Worksheet
Pie Chart Practice: Colored Pencils
Worksheet
Pie Chart Practice: Colored Pencils
Your child might not be ready for statistics, but they can practice using pie charts with this fun, cute worksheet.
Second Grade
Data and Graphing
Worksheet
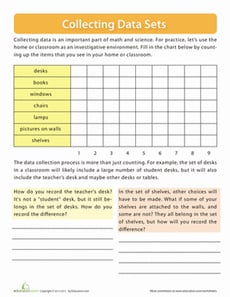
Collecting Data
Worksheet
Collecting Data
Third Grade
Data and Graphing
Collecting data is an important part of math and statistics. Practice gathering data using items around the house or classroom!
Worksheet
Collecting Data
Worksheet
Collecting Data
Collecting data is an important part of math and statistics. Practice gathering data using items around the house or classroom!
Third Grade
Data and Graphing
Worksheet
Feline Delights: Scatter Plots Performance Task
Worksheet
Feline Delights: Scatter Plots Performance Task
Eighth Grade
Algebra
Students apply their knowledge of statistics and probability in a real-world context in this two-page performance task!
Worksheet
Feline Delights: Scatter Plots Performance Task
Worksheet
Feline Delights: Scatter Plots Performance Task
Students apply their knowledge of statistics and probability in a real-world context in this two-page performance task!
Eighth Grade
Algebra
Worksheet
Flower Pie Chart
Worksheet
Flower Pie Chart
Second Grade
Data and Graphing
Even if your child isn't ready for statistics, he can learn to get his bearings around charts and graphs with this simple flower-themed pie chart worksheet.
Worksheet
Flower Pie Chart
Worksheet
Flower Pie Chart
Even if your child isn't ready for statistics, he can learn to get his bearings around charts and graphs with this simple flower-themed pie chart worksheet.
Second Grade
Data and Graphing
Worksheet
Coin Toss Probability
Worksheet
Coin Toss Probability
Fifth Grade
Data and Graphing
We all know a coin toss gives you a 50% chance of winning, but is it always that way? Delve into the inner-workings of coin toss probability with this activity.
Worksheet
Coin Toss Probability
Worksheet
Coin Toss Probability
We all know a coin toss gives you a 50% chance of winning, but is it always that way? Delve into the inner-workings of coin toss probability with this activity.
Fifth Grade
Data and Graphing
Worksheet
Favorite Cities Bar Graph
Worksheet
Favorite Cities Bar Graph
Second Grade
Data and Graphing
Can your second grader make her own bar chart? Use this pretend survey of 38 people and their favorite cities to find out!
Worksheet
Favorite Cities Bar Graph
Worksheet
Favorite Cities Bar Graph
Can your second grader make her own bar chart? Use this pretend survey of 38 people and their favorite cities to find out!
Second Grade
Data and Graphing
Worksheet
Practice Finding Range
Worksheet
Practice Finding Range
Sixth Grade
Data and Graphing
Give your students practice finding the range of a data set with this sixth-grade data and graphing worksheet!
Worksheet
Practice Finding Range
Worksheet
Practice Finding Range
Give your students practice finding the range of a data set with this sixth-grade data and graphing worksheet!
Sixth Grade
Data and Graphing
Worksheet
Comparing Pictographs: Football Time
Worksheet
Comparing Pictographs: Football Time
Third Grade
Data and Graphing
In this math worksheet, kids compare two pictographs that record the number of footballs kicked and the number of footballs thrown on the field.
Worksheet
Comparing Pictographs: Football Time
Worksheet
Comparing Pictographs: Football Time
In this math worksheet, kids compare two pictographs that record the number of footballs kicked and the number of footballs thrown on the field.
Third Grade
Data and Graphing
Worksheet
Making Comparative Inferences
Worksheet
Making Comparative Inferences
Seventh Grade
Data and Graphing
Give students practice creating box plots and making comparative inferences with this seventh-grade math worksheet!
Worksheet
Making Comparative Inferences
Worksheet
Making Comparative Inferences
Give students practice creating box plots and making comparative inferences with this seventh-grade math worksheet!
Seventh Grade
Data and Graphing
Worksheet
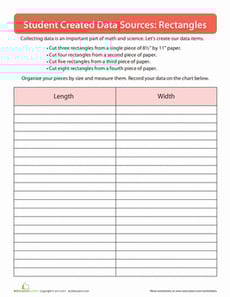
Creating Data
Worksheet
Creating Data
Third Grade
Measurement
Practice creating your own data sources in this introductory graphing activity.
Worksheet
Creating Data
Worksheet
Creating Data
Practice creating your own data sources in this introductory graphing activity.
Third Grade
Measurement
Worksheet
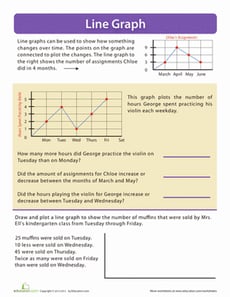
Line Graph
Worksheet
Line Graph
Third Grade
Data and Graphing
Introduce your math whiz to line graphs with this comprehensive lesson. Kids will read information on a line graph and plot some data as well.
Worksheet
Line Graph
Worksheet
Line Graph
Introduce your math whiz to line graphs with this comprehensive lesson. Kids will read information on a line graph and plot some data as well.
Third Grade
Data and Graphing
Worksheet
Introduction to Probability
Worksheet
Introduction to Probability
Fourth Grade
Data and Graphing
This bag of sports balls needs sorting! Introduce your child to probability concepts with this worksheet.
Worksheet
Introduction to Probability
Worksheet
Introduction to Probability
This bag of sports balls needs sorting! Introduce your child to probability concepts with this worksheet.
Fourth Grade
Data and Graphing
Worksheet
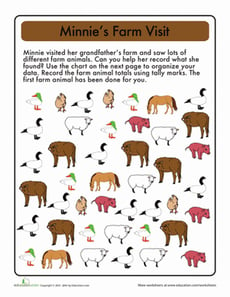
Tally Time: On the Farm
Worksheet
Tally Time: On the Farm
First Grade
Data and Graphing
Kids help Minnie figure out how many pigs, sheep, and other animals live on the farm by reading the tables and counting up the tally marks.
Worksheet
Tally Time: On the Farm
Worksheet
Tally Time: On the Farm
Kids help Minnie figure out how many pigs, sheep, and other animals live on the farm by reading the tables and counting up the tally marks.
First Grade
Data and Graphing
Worksheet
Tally Time: At the Farmers Market
Worksheet
Tally Time: At the Farmers Market
First Grade
Data and Graphing
The farmer needs help keeping track of his vegetables. Can your child use her counting skills to give him a hand?
Worksheet
Tally Time: At the Farmers Market
Worksheet
Tally Time: At the Farmers Market
The farmer needs help keeping track of his vegetables. Can your child use her counting skills to give him a hand?
First Grade
Data and Graphing
Worksheet
Box Plots #1
Interactive Worksheet
Box Plots #1
Sixth Grade
Data and Graphing
Practice interpreting box plots with this sixth-grade worksheet!
Interactive Worksheet
Box Plots #1
Interactive Worksheet
Box Plots #1
Practice interpreting box plots with this sixth-grade worksheet!
Sixth Grade
Data and Graphing
Interactive Worksheet
Create Histograms From Data Sets
Worksheet
Create Histograms From Data Sets
Sixth Grade
Data and Graphing
Draw data to show a scientist’s findings in this practical worksheet!
Worksheet
Create Histograms From Data Sets
Worksheet
Create Histograms From Data Sets
Draw data to show a scientist’s findings in this practical worksheet!
Sixth Grade
Data and Graphing
Worksheet
What's the Probability?
Worksheet
What's the Probability?
Seventh Grade
Data and Graphing
This math worksheet offers students hands-on practice in calculating probability through simple, familiar scenarios.
Worksheet
What's the Probability?
Worksheet
What's the Probability?
This math worksheet offers students hands-on practice in calculating probability through simple, familiar scenarios.
Seventh Grade
Data and Graphing
Worksheet
Creating Histograms From Frequency Tables
Worksheet
Creating Histograms From Frequency Tables
Sixth Grade
Data and Graphing
Practice using histograms to show different sets of data in this engaging sixth-grade worksheet!
Worksheet
Creating Histograms From Frequency Tables
Worksheet
Creating Histograms From Frequency Tables
Practice using histograms to show different sets of data in this engaging sixth-grade worksheet!
Sixth Grade
Data and Graphing
Worksheet
Box Plots #3
Interactive Worksheet
Box Plots #3
Sixth Grade
Data and Graphing
Become an expert at interpreting box plots with this sixth-grade worksheet!
Interactive Worksheet
Box Plots #3
Interactive Worksheet
Box Plots #3
Become an expert at interpreting box plots with this sixth-grade worksheet!
Sixth Grade
Data and Graphing
Interactive Worksheet
Probability Dice: Practice With Probability Models
Worksheet
Probability Dice: Practice With Probability Models
Seventh Grade
Data and Graphing
Probability can be as easy as rolling dice! What is the probability of rolling a 2? What about a 6? Practice calculating basic probability with this worksheet.
Worksheet
Probability Dice: Practice With Probability Models
Worksheet
Probability Dice: Practice With Probability Models
Probability can be as easy as rolling dice! What is the probability of rolling a 2? What about a 6? Practice calculating basic probability with this worksheet.
Seventh Grade
Data and Graphing
Worksheet
Interpreting Slopes and y-Intercepts of Lines of Best Fit
Worksheet
Interpreting Slopes and y-Intercepts of Lines of Best Fit
Eighth Grade
Algebra
Students interpret slopes and
y
-intercepts of lines of best fit based on real-world scenarios in this eighth-grade worksheet!
Worksheet
Interpreting Slopes and y-Intercepts of Lines of Best Fit
Worksheet
Interpreting Slopes and y-Intercepts of Lines of Best Fit
Students interpret slopes and
y
-intercepts of lines of best fit based on real-world scenarios in this eighth-grade worksheet!
Eighth Grade
Algebra
Worksheet
Tally Chart: At the Sushi Counter
Worksheet
Tally Chart: At the Sushi Counter
First Grade
Data and Graphing
The chef made a lot of sushi today during lunch. Can your child help him figure out how much sushi he made by filling in the table with tally marks?
Worksheet
Tally Chart: At the Sushi Counter
Worksheet
Tally Chart: At the Sushi Counter
The chef made a lot of sushi today during lunch. Can your child help him figure out how much sushi he made by filling in the table with tally marks?
First Grade
Data and Graphing
Worksheet
Creating Box Plots
Worksheet
Creating Box Plots
Sixth Grade
Data and Graphing
Learn to draw your own box plots to show data in this informative sixth-grade worksheet!
Worksheet
Creating Box Plots
Worksheet
Creating Box Plots
Learn to draw your own box plots to show data in this informative sixth-grade worksheet!
Sixth Grade
Data and Graphing
Worksheet
Build a Bar Graph: Favorite Wild Animals
Worksheet
Build a Bar Graph: Favorite Wild Animals
Second Grade
Data and Graphing
Analyze a bar graph with this second-grade worksheet!
Worksheet
Build a Bar Graph: Favorite Wild Animals
Worksheet
Build a Bar Graph: Favorite Wild Animals
Analyze a bar graph with this second-grade worksheet!
Second Grade
Data and Graphing
Worksheet
1