SKIP TO CONTENT
Worksheet Generator
Subjects
Grades
Worksheets
Games
Build a Worksheet
More Resources
Roly Recommends
Math Month
Subjects
Grades
Worksheets
Games
Build a Worksheet
More Resources
Roly Recommends
Math Month
All Subjects
Math
Data and Graphing
Subtopics:
Collecting and Organizing Data
Picture Graphs
Bar Graphs
Line Plots
Coordinate Plane
Box Plots
Histograms
Scatter Plots
Show Less
Filters
Search for: more, or, less
✕
Math
✕
Worksheets
✕
Subjects
Math
English Language Arts
Science
Social Studies
Foreign Language
Grade Level
Pre-K
K
1st
2nd
3rd
4th
5th
6th
7th
8th
Early Childhood
Elementary School
Middle School
Resource Type
Worksheets
Games
Lesson Plans
Interactive Worksheets
Workbooks
Activities
Offline Games
Guided Lessons
Occasion
Summer
Halloween
Holidays
Valentine's Day
Common Core
Yes
See More
Clear All
View 98 results
Showing Results for more or less : Page 3
98 results
Search for: more, or, less
✕
Math
✕
Worksheets
✕
Clear All
Sort by:
Relevance
Most recent
Most popular
Alphabetical A-Z
Alphabetical Z-A
All filters
98 results
Sort by:
Relevance
Most recent
Most popular
Alphabetical A-Z
Alphabetical Z-A
Garden Graphing
Worksheet
Garden Graphing
First Grade
Data and Graphing
Kids boost counting and graphing skills as they make a graph to illustrate the rabbit's garden vegetable pickings.
Worksheet
Garden Graphing
Worksheet
Garden Graphing
Kids boost counting and graphing skills as they make a graph to illustrate the rabbit's garden vegetable pickings.
First Grade
Data and Graphing
Worksheet
Garden Graphing: Count and Color!
Worksheet
Garden Graphing: Count and Color!
First Grade
Data and Graphing
Carrots, turnips and potatoes, oh my! Count how many of each vegetable our furry farmer picked and then fill in the graph for each vegetable.
Worksheet
Garden Graphing: Count and Color!
Worksheet
Garden Graphing: Count and Color!
Carrots, turnips and potatoes, oh my! Count how many of each vegetable our furry farmer picked and then fill in the graph for each vegetable.
First Grade
Data and Graphing
Worksheet
Practice Reading Venn Diagrams #3: Favorite Dessert
Worksheet
Practice Reading Venn Diagrams #3: Favorite Dessert
Second Grade
Data and Graphing
Kids practice reading a Venn diagram about favorite desserts and answer questions about it in this 2nd grade math worksheet.
Worksheet
Practice Reading Venn Diagrams #3: Favorite Dessert
Worksheet
Practice Reading Venn Diagrams #3: Favorite Dessert
Kids practice reading a Venn diagram about favorite desserts and answer questions about it in this 2nd grade math worksheet.
Second Grade
Data and Graphing
Worksheet
Pictograph Practice: Hamburger Cafe
Worksheet
Pictograph Practice: Hamburger Cafe
Second Grade
Data and Graphing
Pictographs are a great introduction to working with data and graphs. Kids help the hamburger cafe compare the number of hamburgers they sold using pictographs.
Worksheet
Pictograph Practice: Hamburger Cafe
Worksheet
Pictograph Practice: Hamburger Cafe
Pictographs are a great introduction to working with data and graphs. Kids help the hamburger cafe compare the number of hamburgers they sold using pictographs.
Second Grade
Data and Graphing
Worksheet
Name the Quadrant
Worksheet
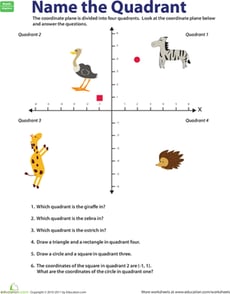
Name the Quadrant
Fifth Grade
Data and Graphing
Help your fifth grader get to know the coordinate plane with this introductory worksheet that challenges him to practice identifying quadrants.
Worksheet
Name the Quadrant
Worksheet
Name the Quadrant
Help your fifth grader get to know the coordinate plane with this introductory worksheet that challenges him to practice identifying quadrants.
Fifth Grade
Data and Graphing
Worksheet
Coordinate Grid Map
Worksheet
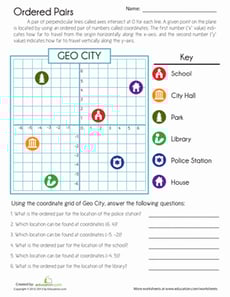
Coordinate Grid Map
Sixth Grade
Geometry
Navigate this map of Geo City! Put those graphing skills to the test by identifying and locating ordered pairs on this coordinate grid map.
Worksheet
Coordinate Grid Map
Worksheet
Coordinate Grid Map
Navigate this map of Geo City! Put those graphing skills to the test by identifying and locating ordered pairs on this coordinate grid map.
Sixth Grade
Geometry
Worksheet
Understanding Charts: Muscleville Medals!
Worksheet
Understanding Charts: Muscleville Medals!
Third Grade
Data and Graphing
Looking for a worksheet to practice your third grader's chart reading skills? This printable works with interpreting charts.
Worksheet
Understanding Charts: Muscleville Medals!
Worksheet
Understanding Charts: Muscleville Medals!
Looking for a worksheet to practice your third grader's chart reading skills? This printable works with interpreting charts.
Third Grade
Data and Graphing
Worksheet
Graphing Proportional Relationships
Worksheet
Graphing Proportional Relationships
Eighth Grade
Ratios and Proportions
Practice graphing proportional relationships and finding the constant of proportionality with this eighth-grade math worksheet!
Worksheet
Graphing Proportional Relationships
Worksheet
Graphing Proportional Relationships
Practice graphing proportional relationships and finding the constant of proportionality with this eighth-grade math worksheet!
Eighth Grade
Ratios and Proportions
Worksheet
Simulate Compound Events #1
Worksheet
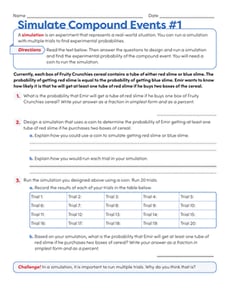
Simulate Compound Events #1
Seventh Grade
Data and Graphing
Practice designing a simulation for real-world compound events with this seventh-grade probability worksheet!
Worksheet
Simulate Compound Events #1
Worksheet
Simulate Compound Events #1
Practice designing a simulation for real-world compound events with this seventh-grade probability worksheet!
Seventh Grade
Data and Graphing
Worksheet
Solving Systems of Linear Equations By Graphing, Substitution, and Elimination Guided Notes
Worksheet
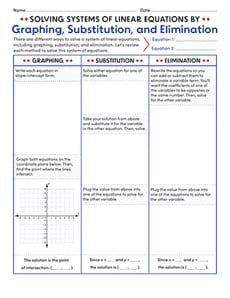
Solving Systems of Linear Equations By Graphing, Substitution, and Elimination Guided Notes
Eighth Grade
Algebra
Use these guided notes to give students confidence in solving systems of equations using graphing, substitution, and elimination methods!
Worksheet
Solving Systems of Linear Equations By Graphing, Substitution, and Elimination Guided Notes
Worksheet
Solving Systems of Linear Equations By Graphing, Substitution, and Elimination Guided Notes
Use these guided notes to give students confidence in solving systems of equations using graphing, substitution, and elimination methods!
Eighth Grade
Algebra
Worksheet
Perimeter on the Coordinate Plane #3
Worksheet
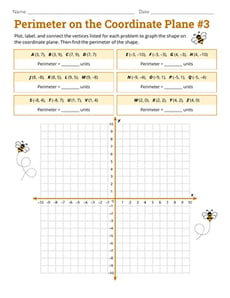
Perimeter on the Coordinate Plane #3
Sixth Grade
Geometry
Give learners additional practice finding perimeter on the coordinate plane with this sixth-grade math worksheet!
Worksheet
Perimeter on the Coordinate Plane #3
Worksheet
Perimeter on the Coordinate Plane #3
Give learners additional practice finding perimeter on the coordinate plane with this sixth-grade math worksheet!
Sixth Grade
Geometry
Worksheet
Ski Trail Tracker #8
Worksheet
Ski Trail Tracker #8
Fifth Grade
Data and Graphing
Show your fifth grader how to practice geometry and division sporty style with this fun math worksheet!
Worksheet
Ski Trail Tracker #8
Worksheet
Ski Trail Tracker #8
Show your fifth grader how to practice geometry and division sporty style with this fun math worksheet!
Fifth Grade
Data and Graphing
Worksheet
Sort 2D and 3D Shapes
Interactive Worksheet
Sort 2D and 3D Shapes
Kindergarten
Geometry
Can your kid tell the difference between 2-dimensional and 3-dimensional shapes? Kindergarten is a good time to start!
Interactive Worksheet
Sort 2D and 3D Shapes
Interactive Worksheet
Sort 2D and 3D Shapes
Can your kid tell the difference between 2-dimensional and 3-dimensional shapes? Kindergarten is a good time to start!
Kindergarten
Geometry
Interactive Worksheet
Interpreting Two-Way Frequency Tables
Worksheet
Interpreting Two-Way Frequency Tables
Eighth Grade
Data and Graphing
Students analyze two-way frequency tables in the context of relatable scenarios in this eighth-grade math worksheet!
Worksheet
Interpreting Two-Way Frequency Tables
Worksheet
Interpreting Two-Way Frequency Tables
Students analyze two-way frequency tables in the context of relatable scenarios in this eighth-grade math worksheet!
Eighth Grade
Data and Graphing
Worksheet
Scatter Plots
Worksheet
Scatter Plots
Eighth Grade
Data and Graphing
Students practice identifying outliers and the types of associations shown on scatter plots in this eighth-grade data and graphing worksheet!
Worksheet
Scatter Plots
Worksheet
Scatter Plots
Students practice identifying outliers and the types of associations shown on scatter plots in this eighth-grade data and graphing worksheet!
Eighth Grade
Data and Graphing
Worksheet
Plot the Coordinates to Draw a Picture
Worksheet
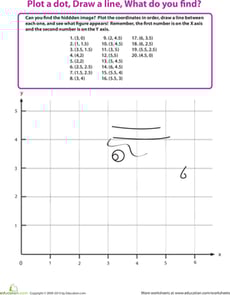
Plot the Coordinates to Draw a Picture
Fourth Grade
Geometry
Your fourth grader will learn about coordinates and get fine motor skill practice as she plots the coordinates, connects the dots, and draws a silly picture!
Worksheet
Plot the Coordinates to Draw a Picture
Worksheet
Plot the Coordinates to Draw a Picture
Your fourth grader will learn about coordinates and get fine motor skill practice as she plots the coordinates, connects the dots, and draws a silly picture!
Fourth Grade
Geometry
Worksheet
Practice Reading Venn Diagrams #1: Favorite Hobby
Worksheet
Practice Reading Venn Diagrams #1: Favorite Hobby
Second Grade
Data and Graphing
Kids practice reading a Venn diagram about favorite hobbies and answer questions about it in this 2nd grade math worksheet.
Worksheet
Practice Reading Venn Diagrams #1: Favorite Hobby
Worksheet
Practice Reading Venn Diagrams #1: Favorite Hobby
Kids practice reading a Venn diagram about favorite hobbies and answer questions about it in this 2nd grade math worksheet.
Second Grade
Data and Graphing
Worksheet
Cut and Categorize #2
Worksheet
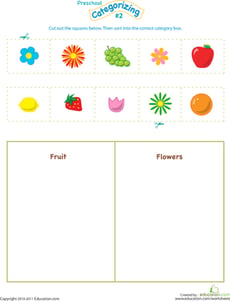
Cut and Categorize #2
Pre-K
Data and Graphing
Help your preschooler clue into categories with this adorable worksheet! It asks her to cut out each pretty picture, and then glue it into its proper spot.
Worksheet
Cut and Categorize #2
Worksheet
Cut and Categorize #2
Help your preschooler clue into categories with this adorable worksheet! It asks her to cut out each pretty picture, and then glue it into its proper spot.
Pre-K
Data and Graphing
Worksheet
Tally Time: At the Farmers Market
Worksheet
Tally Time: At the Farmers Market
First Grade
Data and Graphing
The farmer needs help keeping track of his vegetables. Can your child use her counting skills to give him a hand?
Worksheet
Tally Time: At the Farmers Market
Worksheet
Tally Time: At the Farmers Market
The farmer needs help keeping track of his vegetables. Can your child use her counting skills to give him a hand?
First Grade
Data and Graphing
Worksheet
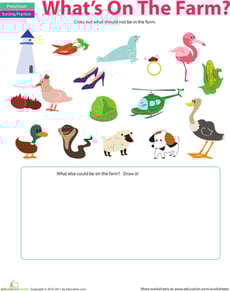
Sorting Activity: What Doesn't Belong?
Worksheet
Sorting Activity: What Doesn't Belong?
Pre-K
Data and Graphing
Can your preschooler solver this sorting activity? In this sorting worksheet, she'll use her logic to find the items and animals that don't belong.
Worksheet
Sorting Activity: What Doesn't Belong?
Worksheet
Sorting Activity: What Doesn't Belong?
Can your preschooler solver this sorting activity? In this sorting worksheet, she'll use her logic to find the items and animals that don't belong.
Pre-K
Data and Graphing
Worksheet
Practice Reading Venn Diagrams #2: In the Orchestra
Worksheet
Practice Reading Venn Diagrams #2: In the Orchestra
Second Grade
Data and Graphing
Kids practice reading a Venn diagram about instruments in an orchestra and answering questions about it in this 2nd grade math worksheet.
Worksheet
Practice Reading Venn Diagrams #2: In the Orchestra
Worksheet
Practice Reading Venn Diagrams #2: In the Orchestra
Kids practice reading a Venn diagram about instruments in an orchestra and answering questions about it in this 2nd grade math worksheet.
Second Grade
Data and Graphing
Worksheet
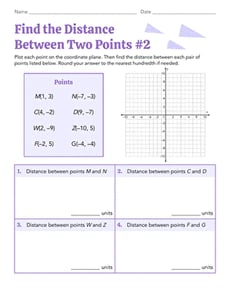
Find the Distance Between Two Points #2
Worksheet
Find the Distance Between Two Points #2
Eighth Grade
Geometry
Test your geometry skills and use the Pythagorean theorem in this eighth-grade worksheet!
Worksheet
Find the Distance Between Two Points #2
Worksheet
Find the Distance Between Two Points #2
Test your geometry skills and use the Pythagorean theorem in this eighth-grade worksheet!
Eighth Grade
Geometry
Worksheet
Create Histograms From Data Sets
Worksheet
Create Histograms From Data Sets
Sixth Grade
Data and Graphing
Draw data to show a scientist’s findings in this practical worksheet!
Worksheet
Create Histograms From Data Sets
Worksheet
Create Histograms From Data Sets
Draw data to show a scientist’s findings in this practical worksheet!
Sixth Grade
Data and Graphing
Worksheet
Let's Draw: Create Line Plots
Worksheet
Let's Draw: Create Line Plots
Sixth Grade
Data and Graphing
Use data from a farmers' market to create your own line plots in this sixth-grade worksheet!
Worksheet
Let's Draw: Create Line Plots
Worksheet
Let's Draw: Create Line Plots
Use data from a farmers' market to create your own line plots in this sixth-grade worksheet!
Sixth Grade
Data and Graphing
Worksheet
What's the Probability?
Worksheet
What's the Probability?
Seventh Grade
Data and Graphing
This math worksheet offers students hands-on practice in calculating probability through simple, familiar scenarios.
Worksheet
What's the Probability?
Worksheet
What's the Probability?
This math worksheet offers students hands-on practice in calculating probability through simple, familiar scenarios.
Seventh Grade
Data and Graphing
Worksheet
Graph Basics: Line Graphs
Worksheet
Graph Basics: Line Graphs
Third Grade
Data and Graphing
Learn how to read, analyze, and create a line graph with this helpful math worksheet!
Worksheet
Graph Basics: Line Graphs
Worksheet
Graph Basics: Line Graphs
Learn how to read, analyze, and create a line graph with this helpful math worksheet!
Third Grade
Data and Graphing
Worksheet
Find the Distance Between Two Points #1
Worksheet
Find the Distance Between Two Points #1
Eighth Grade
Geometry
Practice the Pythagorean theorem with this eighth-grade geometry worksheet!
Worksheet
Find the Distance Between Two Points #1
Worksheet
Find the Distance Between Two Points #1
Practice the Pythagorean theorem with this eighth-grade geometry worksheet!
Eighth Grade
Geometry
Worksheet
Creating Histograms From Frequency Tables
Worksheet
Creating Histograms From Frequency Tables
Sixth Grade
Data and Graphing
Practice using histograms to show different sets of data in this engaging sixth-grade worksheet!
Worksheet
Creating Histograms From Frequency Tables
Worksheet
Creating Histograms From Frequency Tables
Practice using histograms to show different sets of data in this engaging sixth-grade worksheet!
Sixth Grade
Data and Graphing
Worksheet
From Dot Plots to Histograms
Worksheet
From Dot Plots to Histograms
Sixth Grade
Data and Graphing
Discover different ways to display data in this delightful sixth-grade worksheet!
Worksheet
From Dot Plots to Histograms
Worksheet
From Dot Plots to Histograms
Discover different ways to display data in this delightful sixth-grade worksheet!
Sixth Grade
Data and Graphing
Worksheet
Probability Dice: Practice With Probability Models
Worksheet
Probability Dice: Practice With Probability Models
Seventh Grade
Data and Graphing
Probability can be as easy as rolling dice! What is the probability of rolling a 2? What about a 6? Practice calculating basic probability with this worksheet.
Worksheet
Probability Dice: Practice With Probability Models
Worksheet
Probability Dice: Practice With Probability Models
Probability can be as easy as rolling dice! What is the probability of rolling a 2? What about a 6? Practice calculating basic probability with this worksheet.
Seventh Grade
Data and Graphing
Worksheet
1
2
3
4