SKIP TO CONTENT
Worksheet Generator
Subjects
Grades
Worksheets
Games
Build a Worksheet
More Resources
Roly Recommends
Subjects
Grades
Worksheets
Games
Build a Worksheet
More Resources
Roly Recommends
All Subjects
Math
Data and Graphing
Subtopics:
Collecting and Organizing Data
Picture Graphs
Bar Graphs
Line Plots
Coordinate Plane
Box Plots
Histograms
Scatter Plots
Show Less
Filters
Search for: same, and, different, worksheets
✕
Math
✕
Worksheets
✕
Subjects
Math
English Language Arts
Science
Social Studies
Foreign Language
Grade Level
Pre-K
K
1st
2nd
3rd
4th
5th
6th
7th
8th
Early Childhood
Elementary School
Middle School
Resource Type
Worksheets
Games
Lesson Plans
Interactive Worksheets
Workbooks
Activities
Stories
Songs
Offline Games
Guided Lessons
Occasion
Easter
Earth Day
Summer
Holidays
Valentine's Day
Common Core
Yes
Game Type
Mazes
Arts & Crafts
Arts & Crafts
Paper & Glue Crafts
See More
Clear All
View 161 results
Showing Results for same and different worksheets : Page 6
161 results
Search for: same, and, different, worksheets
✕
Math
✕
Worksheets
✕
Clear All
Sort by:
Relevance
Most recent
Most popular
Alphabetical A-Z
Alphabetical Z-A
All filters
161 results
Sort by:
Relevance
Most recent
Most popular
Alphabetical A-Z
Alphabetical Z-A
Describing Distributions in Dot Plots
Worksheet
Describing Distributions in Dot Plots
Sixth Grade
Data and Graphing
Students explore distributions in dot plots with this sixth-grade statistics worksheet!
Worksheet
Describing Distributions in Dot Plots
Worksheet
Describing Distributions in Dot Plots
Students explore distributions in dot plots with this sixth-grade statistics worksheet!
Sixth Grade
Data and Graphing
Worksheet
Practice Graphs
Worksheet
Practice Graphs
Second Grade
Data and Graphing
Kids practice representing a set of data using three kinds of graphs: a bar graph, pictograph, and pie graph.
Worksheet
Practice Graphs
Worksheet
Practice Graphs
Kids practice representing a set of data using three kinds of graphs: a bar graph, pictograph, and pie graph.
Second Grade
Data and Graphing
Worksheet
Reading a Bar Graph: Number of Athletes
Worksheet
Reading a Bar Graph: Number of Athletes
Third Grade
Data and Graphing
In this sports-themed worksheet, children use a bar graph to answer six questions about the number of athletes playing at a time in a variety of sporting events.
Worksheet
Reading a Bar Graph: Number of Athletes
Worksheet
Reading a Bar Graph: Number of Athletes
In this sports-themed worksheet, children use a bar graph to answer six questions about the number of athletes playing at a time in a variety of sporting events.
Third Grade
Data and Graphing
Worksheet
Polygons on the Coordinate Plane Activity
Worksheet
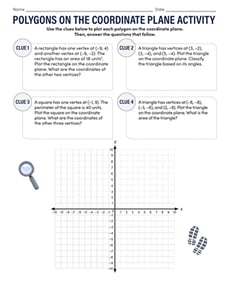
Polygons on the Coordinate Plane Activity
Sixth Grade
Geometry
Put students’ understanding of coordinate planes to the test with this engaging geometry activity!
Worksheet
Polygons on the Coordinate Plane Activity
Worksheet
Polygons on the Coordinate Plane Activity
Put students’ understanding of coordinate planes to the test with this engaging geometry activity!
Sixth Grade
Geometry
Worksheet
Reading Pictographs: Eggplant Cooking
Worksheet
Reading Pictographs: Eggplant Cooking
Third Grade
Data and Graphing
Mr. Chef keeps track of how many eggplants he uses with a pictograph. In this worksheet, kids use information in the pictograph to answer word problems.
Worksheet
Reading Pictographs: Eggplant Cooking
Worksheet
Reading Pictographs: Eggplant Cooking
Mr. Chef keeps track of how many eggplants he uses with a pictograph. In this worksheet, kids use information in the pictograph to answer word problems.
Third Grade
Data and Graphing
Worksheet
Box and Whisker Plot
Worksheet
Box and Whisker Plot
Sixth Grade
Data and Graphing
Students learn how to find the five-number summary and create a box and whisker plot for given data sets.
Worksheet
Box and Whisker Plot
Worksheet
Box and Whisker Plot
Students learn how to find the five-number summary and create a box and whisker plot for given data sets.
Sixth Grade
Data and Graphing
Worksheet
A Festival of Fun: Probability Performance Task
Worksheet
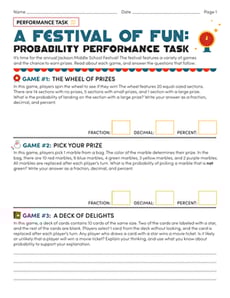
A Festival of Fun: Probability Performance Task
Seventh Grade
Data and Graphing
Students demonstrate their proficiency with probability in this three-page performance task worksheet!
Worksheet
A Festival of Fun: Probability Performance Task
Worksheet
A Festival of Fun: Probability Performance Task
Students demonstrate their proficiency with probability in this three-page performance task worksheet!
Seventh Grade
Data and Graphing
Worksheet
Let's Draw: Create Line Plots
Worksheet
Let's Draw: Create Line Plots
Sixth Grade
Data and Graphing
Use data from a farmers' market to create your own line plots in this sixth-grade worksheet!
Worksheet
Let's Draw: Create Line Plots
Worksheet
Let's Draw: Create Line Plots
Use data from a farmers' market to create your own line plots in this sixth-grade worksheet!
Sixth Grade
Data and Graphing
Worksheet
Box Plots #3
Interactive Worksheet
Box Plots #3
Sixth Grade
Data and Graphing
Become an expert at interpreting box plots with this sixth-grade worksheet!
Interactive Worksheet
Box Plots #3
Interactive Worksheet
Box Plots #3
Become an expert at interpreting box plots with this sixth-grade worksheet!
Sixth Grade
Data and Graphing
Interactive Worksheet
Heart Hunt: Count and Graph
Worksheet
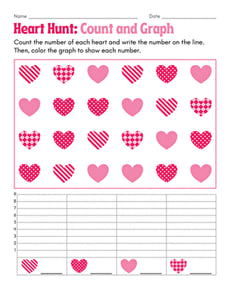
Heart Hunt: Count and Graph
Kindergarten
Numbers and Counting
Hunt for decorative hearts in this Valentine’s Day-themed graphing worksheet for kindergarteners and first graders!
Worksheet
Heart Hunt: Count and Graph
Worksheet
Heart Hunt: Count and Graph
Hunt for decorative hearts in this Valentine’s Day-themed graphing worksheet for kindergarteners and first graders!
Kindergarten
Numbers and Counting
Worksheet
Comparing Pictographs: Football Time
Worksheet
Comparing Pictographs: Football Time
Third Grade
Data and Graphing
In this math worksheet, kids compare two pictographs that record the number of footballs kicked and the number of footballs thrown on the field.
Worksheet
Comparing Pictographs: Football Time
Worksheet
Comparing Pictographs: Football Time
In this math worksheet, kids compare two pictographs that record the number of footballs kicked and the number of footballs thrown on the field.
Third Grade
Data and Graphing
Worksheet
1
2
3
4
5
6