Box Plots Worksheets
About Box Plots Worksheets
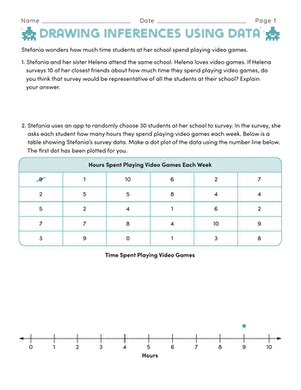
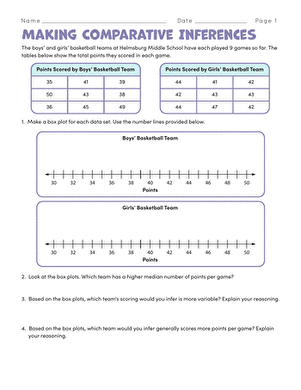
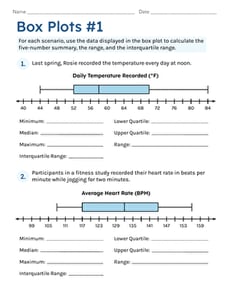
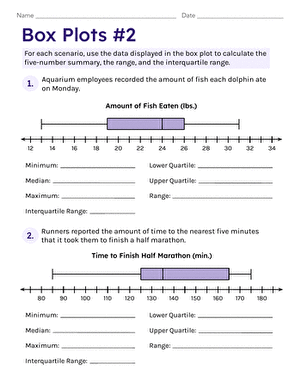
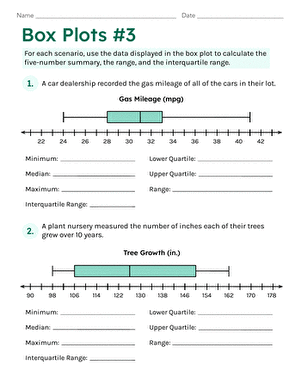
On Education.com, box plots worksheets introduce students to ways of summarizing data visually, helping them analyze and compare distributions. These worksheets cover concepts such as calculating median, quartiles, and interquartile range, and interpreting data within a box plot. They are designed for teachers and parents to support learning in statistics and data analysis across different grade levels.
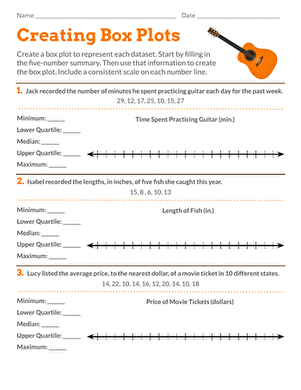
Education.com offers interactive worksheets, printable activities, and lesson plans that help students practice creating and interpreting box plots. These resources promote hands-on learning through graph-building exercises, data set analysis, and real-world application scenarios. Educators can easily incorporate clear examples and step-by-step guidance into classroom instruction, while parents can support at-home practice.
Accessing box plots worksheets on Education.com allows students to develop critical thinking by analyzing summarized data representations. Teachers can provide structured exercises that reinforce mathematical concepts and enhance comfort with data interpretation. Parents can use these activities to strengthen problem-solving skills and introduce foundational statistical methods.

