Line Plots Worksheets


About Line Plots Worksheets
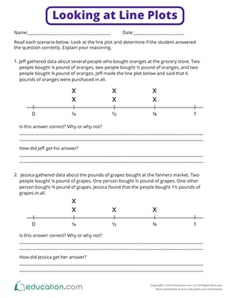
On Education.com, explore a variety of line plots worksheets designed to help students interpret and analyze data visually. These printable resources are essential for practicing skills such as reading graphs, identifying trends, and comparing data sets in mathematics. Each worksheet provides clear datasets, axes labels, and questions to guide student learning. Teachers and parents can easily access structured activities that reinforce statistical concepts and strengthen data interpretation skills.
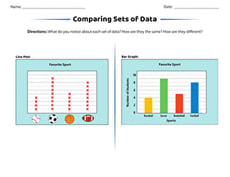
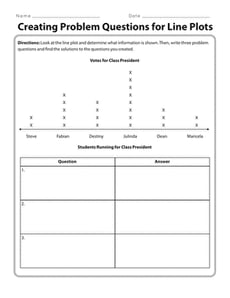
This collection of line plots worksheets offers engaging, educational exercises for elementary students learning to work with graphs. Resources include examples with multiple data points, activities that encourage pattern recognition, and worksheets combined with questions that promote critical thinking. All materials are designed to provide hands-on practice in reading and understanding line graphs while creating a variety of visual data representations.
Looking for ways to improve math skills at home or in the classroom? These line plots worksheets provide ready-to-use exercises that support learning data visualization, reading graphs accurately, and drawing conclusions from information presented visually. They make practicing graph analysis both fun and educational, fostering a deeper understanding of statistical concepts and enhancing problem-solving abilities.