Bar Graphs Worksheets
84 results
Math
✕Worksheets
✕84 results
Bar Graphs Worksheets
84 results
Math
✕Worksheets
✕84 results


About Bar Graphs Worksheets
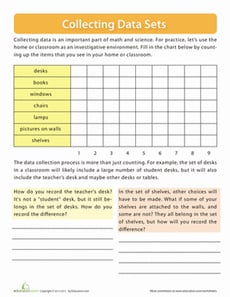
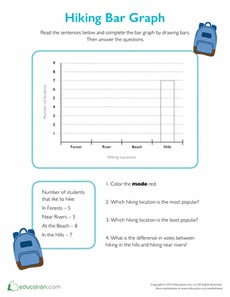
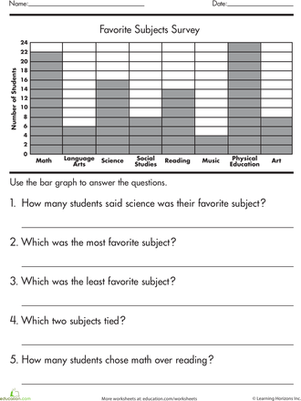
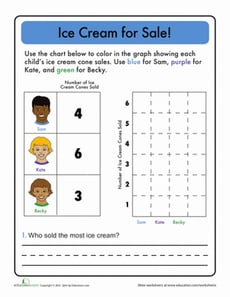
On Education.com, bar graphs worksheets provide students with graphing exercises that build data interpretation and nature skills. These printable pages often include exercises where students create bar graphs from given data, interpret existing graphs, and compare sets of information. This makes it easier for parents and teachers to introduce students to essential math and visual literacy concepts, strengthening both numeric reasoning and critical thinking.
Educators and parents can access a variety of bar graphs resources on Education.com, from structured worksheets and practice sheets to interactive lessons. These materials support hands-on learning by guiding students through graph construction, data analysis, and real-world applications. Educators can use these samples to reinforce classroom sessions or assign at-home practice, while parents can use them to make learning engaging and accessible.
Using bar graphs worksheets from Education.com helps students practice essential report-writing and number-crunching skills while gaining a stronger understanding of how data is collected and visually displayed. Combining illustration, interpretation, and mathematical reasoning makes these activities both educational and engaging. This resource page offers flexible materials that make learning about graphs accessible, effective, and fun for elementary students.