


About Common Core Bar Graphs Worksheets
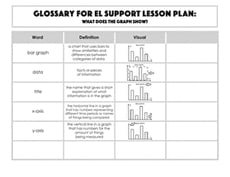
On Education.com, common core bar graphs worksheets help students from PreK-8 learn to read, create, and interpret data using bar graphs. These resources introduce young learners to concepts such as identifying the most and least data points, comparing totals, and understanding data trends, often aligning with standards like 1.MD.C.4 and 3.MD.3. Both printable worksheets and interactive digital activities provide structured practice for building math literacy and charting skills.
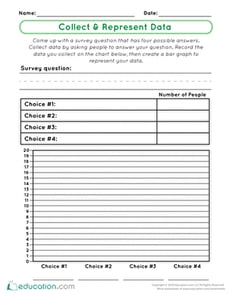
Common Core bar graphs worksheets on Education.com feature activities that cover creating and reading simple scaled graphs, analyzing data comparisons, and drawing conclusions from visual representations. Learners can practice skills across various contexts, from counting objects in a picture graph to tracking class survey results. These resources enable students to develop strong foundational math and data analysis abilities in an engaging, interactive way.
Educators and parents can use these resource pages to reinforce classroom learning or provide at-home practice. Materials are designed to be flexible and adaptable for different learning levels, offering a range of difficulty from basic data representation to detailed comparisons. Everyday lesson planning becomes more efficient with ready-to-use graph activities that encourage critical thinking, pattern recognition, and interpretation.