SKIP TO CONTENT
Worksheet Generator
Subjects
Grades
Worksheets
Games
Build a Worksheet
More Resources
Roly Recommends
Summer Boost
Subjects
Grades
Worksheets
Games
Build a Worksheet
More Resources
Roly Recommends
Summer Boost
Showing Results for seasonal
Filters
Math
Data and Graphing
2 results
Search for: seasonal
✕
Math
✕
Worksheets
✕
Clear all
2 results
Subtopics:
Collecting and Organizing Data
Coordinate Plane
Show Less
Filters
Search for: seasonal
✕
Math
✕
Worksheets
✕
Subjects
Math
English Language Arts
Science
Social Studies
Grade Level
Pre-K
K
1st
2nd
3rd
4th
5th
6th
7th
8th
Early Childhood
Elementary School
Middle School
Resource Type
Worksheets
Activities
Occasion
Halloween
Holidays
Valentine's Day
Common Core
Yes
Clear all
View 2 results
Showing Results for seasonal
Filters
2 results
Search for: seasonal
✕
Math
✕
Worksheets
✕
Clear all
2 results
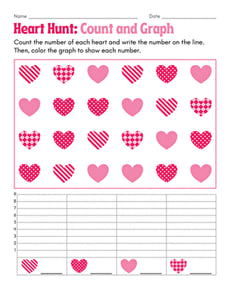
Heart Hunt: Count and Graph
Worksheet
Heart Hunt: Count and Graph
Kindergarten
Numbers and Counting
Hunt for decorative hearts in this Valentine’s Day-themed graphing worksheet for kindergarteners and first graders!
Worksheet
Heart Hunt: Count and Graph
Worksheet
Heart Hunt: Count and Graph
Hunt for decorative hearts in this Valentine’s Day-themed graphing worksheet for kindergarteners and first graders!
Kindergarten
Numbers and Counting
Worksheet
Mystery Picture Graph: All Hallow's Eve
Worksheet
Mystery Picture Graph: All Hallow's Eve
Fifth Grade
Geometry
The coordinate plane just got a little spookier! Can you graph these coordinates to reveal the hidden picture?
Worksheet
Mystery Picture Graph: All Hallow's Eve
Worksheet
Mystery Picture Graph: All Hallow's Eve
The coordinate plane just got a little spookier! Can you graph these coordinates to reveal the hidden picture?
Fifth Grade
Geometry
Worksheet
1