1st Grade Bar Graphs Worksheets
24 results
Math
✕Worksheets
✕1st Grade
✕24 results
1st Grade Bar Graphs Worksheets
24 results
Math
✕Worksheets
✕1st Grade
✕24 results


About 1st Grade Bar Graphs Worksheets
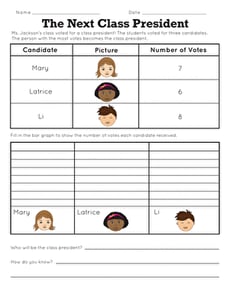
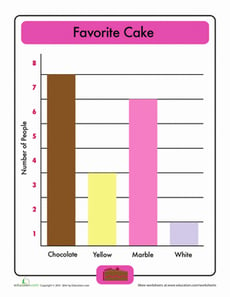
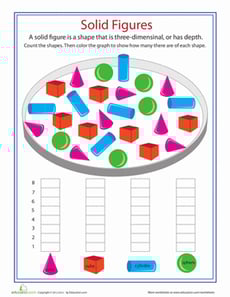
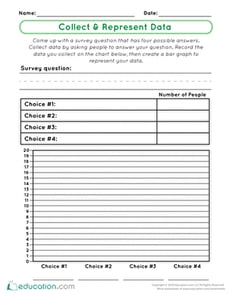
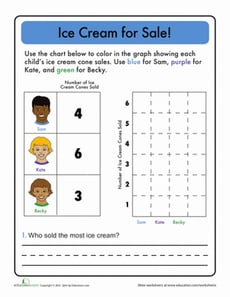
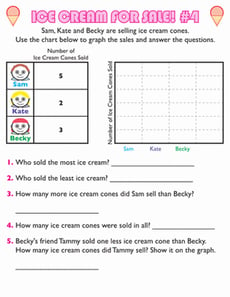
On Education.com, the 1st grade bar graphs worksheets provide students with hands-on opportunities to create and interpret one of the foundational chart types. These worksheets help young learners understand how to organize data visually, compare quantities, and develop early math and observation skills. The examples aim to make learning about charts engaging and accessible for young children, while also strengthening cognitive and analytical abilities.
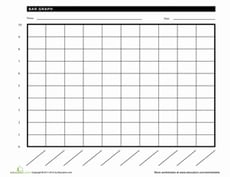
This resource encourages educators and parents to explore printables that include bar graph templates, guided exercises, and activities that support classroom and home learning. These materials provide structured practice with data visualization, counting, and identifying patterns, making abstract concepts more tangible and relatable for 1st grade students.
Using the 1st grade bar graphs worksheets can save time by providing ready-made resources to strengthen basic math skills, support science experiments, or enhance reading and interpretation exercises. This approach combines practical education with interactive practice, helping children build confidence and enthusiasm for mathematics.