1st Grade Data and Graphing Worksheets
66 results
Math
✕Worksheets
✕1st Grade
✕66 results
1st Grade Data and Graphing Worksheets
66 results
Math
✕Worksheets
✕1st Grade
✕66 results


About 1st Grade Data And Graphing Worksheets
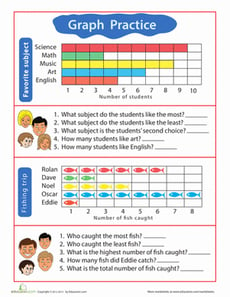
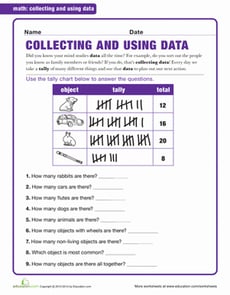
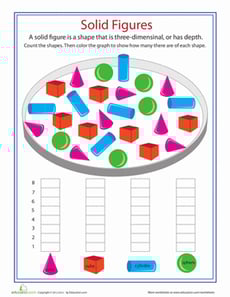
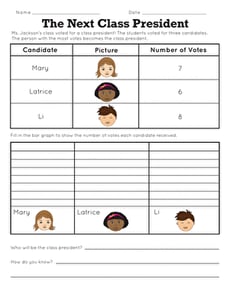
On Education.com, first grade data and graphing worksheets provide young students with activities that help them understand how to organize, analyze, and interpret information. These worksheets introduce concepts such as tally marks, bar graphs, and pictographs, building a foundation for math and data literacy. They are designed to engage early learners with creative and hands-on exercises that make learning both fun and educational. By practicing with these worksheets, children develop critical thinking skills and gain confidence in working with numbers and information visualization.
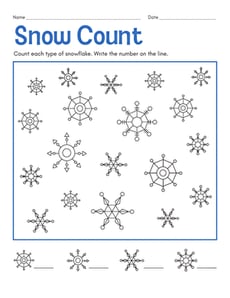
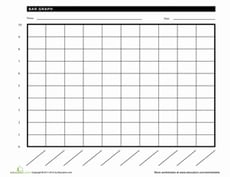
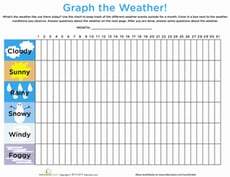
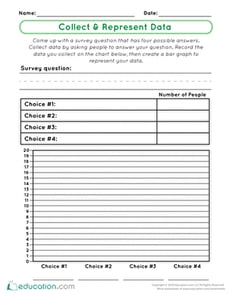
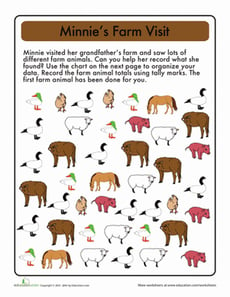
Children can explore a variety of digital worksheets and printable activities that focus on creating and reading simple graphs. These resources allow students to categorize data from classroom surveys, weather observations, or favorite activities, then display it visually. Parents and teachers can use these materials to reinforce counting, pattern recognition, and comparison skills while making data fun and accessible. The worksheets also promote practice in observing details, recording information, and drawing conclusions from visual data displays.
Educators and parents can use first grade data and graphing worksheets to support classroom instruction, homework, or at-home learning. These activities help guide students through the process of gathering data, organizing it into charts or graphs, and explaining what the data shows. With structured worksheets and engaging exercises on Education.com, children build a strong math toolkit while learning how to communicate findings effectively. These resources make it easy to integrate data analysis into early lessons on mathematics and scientific observation.