Picture Graphs Worksheets
77 results
Math
✕Worksheets
✕77 results
Picture Graphs Worksheets
77 results
Math
✕Worksheets
✕77 results


About Picture Graphs Worksheets
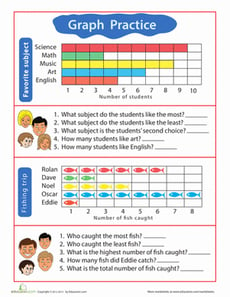
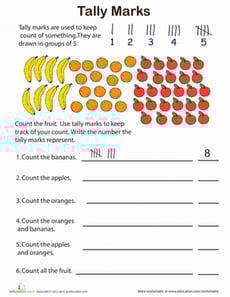
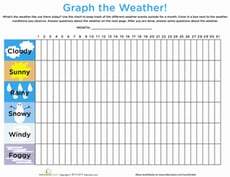
On Education.com, picture graphs worksheets provide young learners with a visual way to interpret and create data representations. These activities introduce students to the basics of graphing by using images to represent quantities, helping them recognize patterns, compare data, and develop early map-reading skills. The worksheets often include practical exercises such as charting classroom preferences, tallying sports scores, or connecting data to real-world contexts.
This page on Education.com features tables and printable worksheets that make data analysis accessible to beginners. Educators and parents can use these engaging materials to reinforce math concepts while fostering critical thinking and observational skills. The worksheets are designed for comfortable use at home or in the classroom, making foundational learning fun and interactive for students starting record-keeping and classification.
Teachers and parents can easily access ready-to-print picture graphs worksheets that support grade-level lessons. Incorporate these activities into lessons on data collection, comparison, or introductory statistics. Using these worksheets periodically encourages consistent practice and helps children become comfortable with graphical information, laying a foundation for more advanced math and data literacy skills.