2nd Grade Common Core Data and Graphing Worksheets
Common Core Quick Links:
Common Core Standards for 2nd Grade Math, Common Core Standards for 2nd Grade ELA


About 2nd Grade Common Core Data And Graphing Worksheets
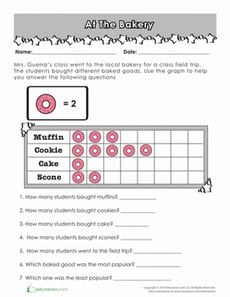
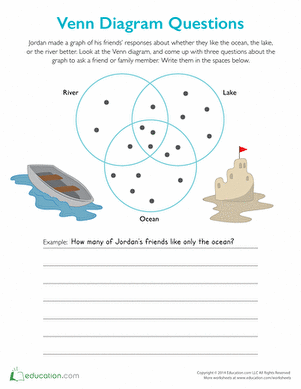
On Education.com, teachers and parents can access a variety of resources including 2nd Grade Common Core Data and Graphing Worksheets that help children develop foundational skills in data collection and interpretation. These worksheets encourage young students to gather information, create simple charts, and analyze datasets, fostering critical thinking in a structured way.
The site offers printable pages and structured lesson plans that integrate graphing activities into math and science instruction. Educators can utilize resources for classroom exercises, while parents can support at-home learning through engaging, hands-on materials. These clearly designed worksheets make data analysis accessible and fun for young learners.
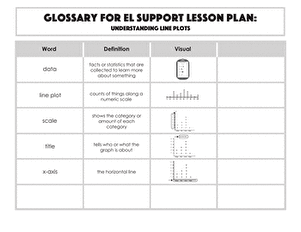
Educators and parents can save time preparing lesson plans or homework by using ready-made data and graphing worksheets. These resources offer engaging prompts to get students involved in categorizing, measuring, and visually representing information. This can enhance understanding while encouraging a practical application of math concepts.
The site offers printable pages and structured lesson plans that integrate graphing activities into math and science instruction. Educators can utilize resources for classroom exercises, while parents can support at-home learning through engaging, hands-on materials. These clearly designed worksheets make data analysis accessible and fun for young learners.
Educators and parents can save time preparing lesson plans or homework by using ready-made data and graphing worksheets. These resources offer engaging prompts to get students involved in categorizing, measuring, and visually representing information. This can enhance understanding while encouraging a practical application of math concepts.