2nd Grade Picture Graphs Worksheets


About 2nd Grade Picture Graphs Worksheets
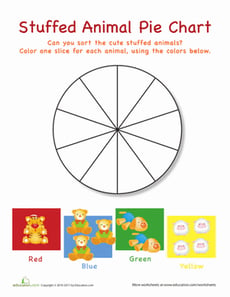
On Education.com, 2nd grade picture graphs worksheets provide students with engaging materials to learn how to collect data, interpret information, and represent it visually. These printable resources help young learners understand concepts like counting, comparing, and organizing data through colorful, easy-to-follow exercises. Educators and parents can use these worksheets to reinforce math skills while making learning fun and accessible.
On Education.com, the site offers a variety of educational resources such as worksheets, printable activities, and interactive lesson plans for teaching data representation. These materials include sugar-coated exercises that introduce children to reading and creating charts, blocks, and pictograms. By exploring this category, students develop critical thinking and observation skills while engaging with hands-on graphing practice.
On Education.com, teachers and parents can access 2nd grade picture graphs worksheets to provide structured, guided practice at home or in the classroom. These resources save planning time by offering ready-to-useMaterials that help children develop confidence in analyzing and organizing information visually. With these worksheets, young learners can gain foundational math skills while enjoying interactive, educational activities.