

3.MD.B Lesson Plans
CCSS.MATH.CONTENT.3.MD.B
:"Represent and interpret data."
These lesson plans can help students practice this Common Core State Standards skill.
Lesson Plans

Organize Your Data
Lesson plan
Organize Your Data
Collect and graph! In this lesson, your students will practice collecting, organizing, and interpreting data by using real life examples.
3rd Grade
Math
Lesson plan

Asking and Answering Questions about Line Plots and Bar Graphs
Lesson plan
Asking and Answering Questions about Line Plots and Bar Graphs
Take students’ understanding of bar graphs and line plots to the next level. This lesson will encourage students to think about how graphs are designed and the questions we can ask and answer about data presented in graphs.
3rd Grade
Math
Lesson plan
What is it Telling Me? Creating and Interpreting Line Plots
Lesson plan
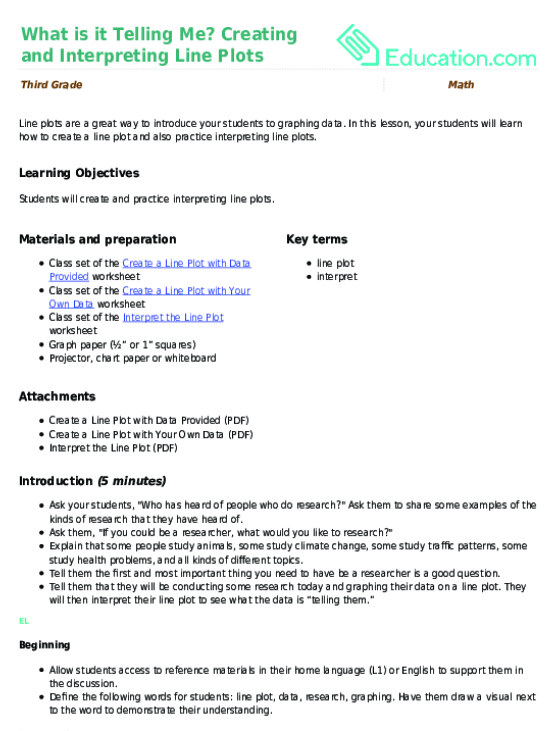
What is it Telling Me? Creating and Interpreting Line Plots
Line plots are a great way to introduce your students to graphing data. In this lesson, your students will learn how to create a line plot and also practice interpreting line plots.
3rd Grade
Math
Lesson plan
Heights on a Data Line Plot
Lesson plan
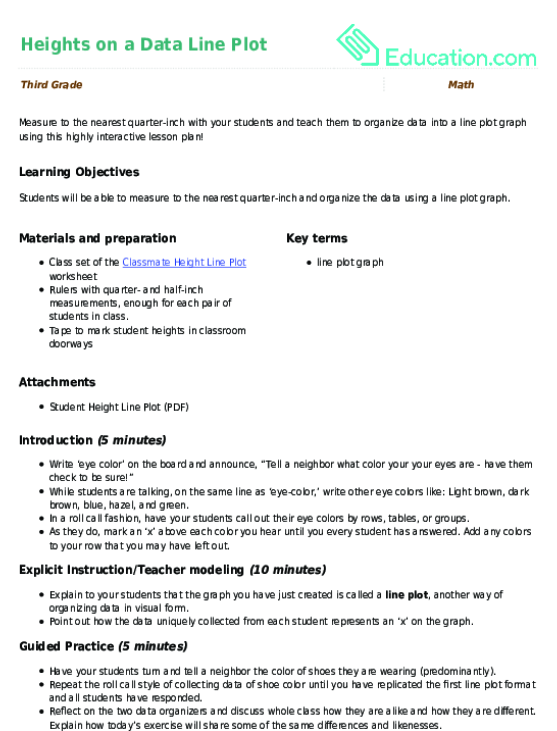
Heights on a Data Line Plot
Measure to the nearest quarter-inch with your students and teach them to organize data into a line plot graph using this highly interactive lesson plan!
3rd Grade
Math
Lesson plan

Let’s Find Out! Answering Questions by Collecting and Organizing Data
Lesson plan
Let’s Find Out! Answering Questions by Collecting and Organizing Data
Your students will practice data collection and graphing while learning more about each other. Your data scientists will craft a survey question, collect data from the class, and then create a bar graph to represent their findings.
3rd Grade
Math
Lesson plan
Interpreting Line Plots, Bar Graphs and Picture Graphs: Word Problems
Lesson plan
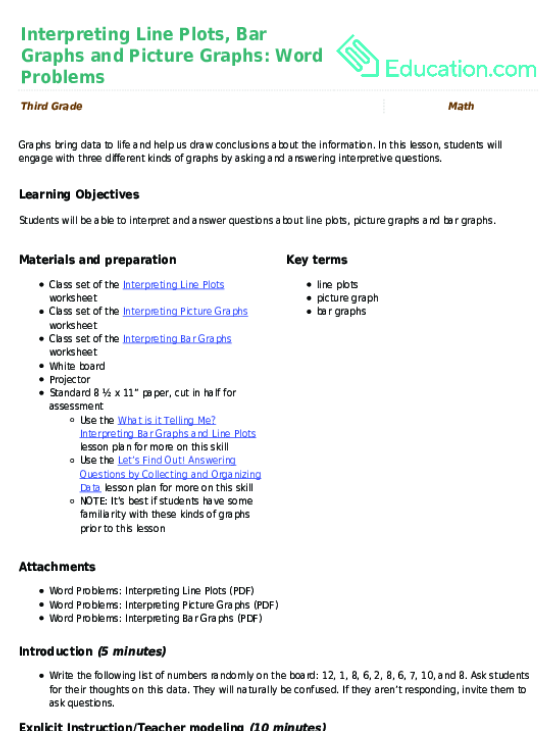
Interpreting Line Plots, Bar Graphs and Picture Graphs: Word Problems
Graphs bring data to life and help us draw conclusions about the information. In this lesson, students will engage with three different kinds of graphs by asking and answering interpretive questions.
3rd Grade
Math
Lesson plan
Making Measurements for Line Plots
Lesson plan
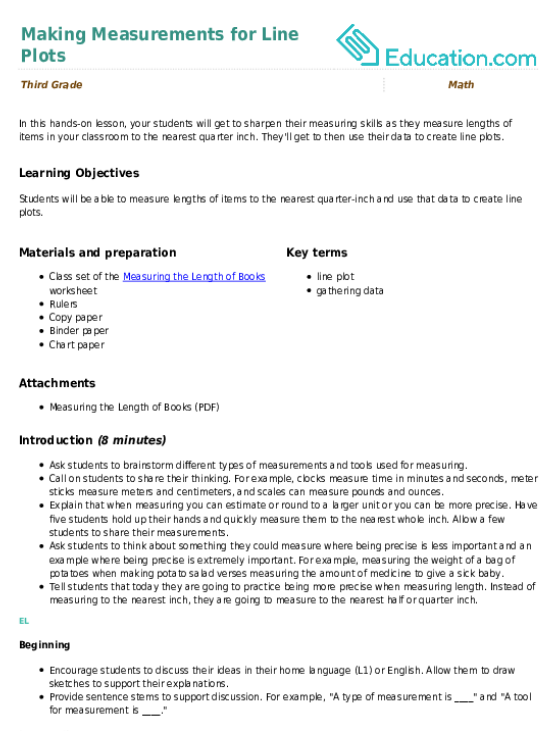
Making Measurements for Line Plots
In this hands-on lesson, your students will get to sharpen their measuring skills as they measure lengths of items in your classroom to the nearest quarter inch. They'll get to then use their data to create line plots.
3rd Grade
Math
Lesson plan

What Does the Graph Show?
Lesson plan
What Does the Graph Show?
Get your students familiar with talking about the data they see in bar graphs. This lesson can stand alone or be used alongside the Organize Your Data lesson.
3rd Grade
Math
Lesson plan

Let's Interpret the Line Plot
Lesson plan
Let's Interpret the Line Plot
Support your students as they build a foundation in data analysis! Use this as an independent lesson or alongside the lesson entitled What is it Telling me? Creating and Interpreting Line Plots.
3rd Grade
Math
Lesson plan

Collect, Organize, and Discuss the Data
Lesson plan
Collect, Organize, and Discuss the Data
Support your students as they collect, organize, and discuss measurement data! Use this lesson independently or alongside Making Measurements for Line Plots.
3rd Grade
Math
Lesson plan
