SKIP TO CONTENT
Worksheet Generator
Subjects
Grades
Worksheets
Games
Build a Worksheet
More Resources
Roly Recommends
Summer Boost
Subjects
Grades
Worksheets
Games
Build a Worksheet
More Resources
Roly Recommends
Summer Boost
Showing Results for graphing data
Filters
548 results
Search for: graphing, data
✕
Activities
✕
Clear all
548 results
Filters
Search for: graphing, data
✕
Activities
✕
Subjects
Math
English Language Arts
Science
Social Studies
Foreign Language
Technology
Grade Level
Pre-K
K
1st
2nd
3rd
4th
5th
6th
7th
8th
Early Childhood
Elementary School
Middle School
Resource Type
Worksheets
Games
Lesson Plans
Interactive Worksheets
Workbooks
Activities
Exercises
Songs
Offline Games
Guided Lessons
Teacher Resources
Occasion
Birthdays
Summer
Halloween
Holidays
Hanukkah
Common Core
Yes
Game Type
Ball Games
Outdoor Games
Arts & Crafts
Arts & Crafts
Paper & Glue Crafts
Construction & Sculpture
Painting & Drawing
Clear all
View 548 results
Showing Results for graphing data
Filters
548 results
Search for: graphing, data
✕
Activities
✕
Clear all
548 results
Pitch and Hit Data
Activity
Pitch and Hit Data
Third Grade
Data and Graphing
Okay, engaging in a graphing activity may sound ho-hum, but if you use fun data, it changes the picture entirely.
Activity
Pitch and Hit Data
Activity
Pitch and Hit Data
Okay, engaging in a graphing activity may sound ho-hum, but if you use fun data, it changes the picture entirely.
Third Grade
Data and Graphing
Activity
What Animals are Most Popular? A Data Analysis Project
Activity
What Animals are Most Popular? A Data Analysis Project
Second Grade
Engineering and Science Inquiry
What animals are most popular? This project affords practice in data-collection, record-keeping and data-analysis through the investigation of this question.
Activity
What Animals are Most Popular? A Data Analysis Project
Activity
What Animals are Most Popular? A Data Analysis Project
What animals are most popular? This project affords practice in data-collection, record-keeping and data-analysis through the investigation of this question.
Second Grade
Engineering and Science Inquiry
Activity
Draw a Birthday Bar Graph
Activity
Draw a Birthday Bar Graph
Third Grade
Data and Graphing
Liven up a lesson about graphing by helping your third grader compile a bar graph from his classmates' birthday data.
Activity
Draw a Birthday Bar Graph
Activity
Draw a Birthday Bar Graph
Liven up a lesson about graphing by helping your third grader compile a bar graph from his classmates' birthday data.
Third Grade
Data and Graphing
Activity
Design a Weather Calendar
Activity
Design a Weather Calendar
Pre-K
Numbers and Counting
This activity turns your kid into the family weatherman. Plus, it teaches him to collect data and begin to understand graphing.
Activity
Design a Weather Calendar
Activity
Design a Weather Calendar
This activity turns your kid into the family weatherman. Plus, it teaches him to collect data and begin to understand graphing.
Pre-K
Numbers and Counting
Activity
Do We Wear the Same Colors?
Activity
Do We Wear the Same Colors?
Third Grade
Data and Graphing
Hone observational skills and introduce the basics of data interpretation with this data gathering activity all about the different colors people wear.
Activity
Do We Wear the Same Colors?
Activity
Do We Wear the Same Colors?
Hone observational skills and introduce the basics of data interpretation with this data gathering activity all about the different colors people wear.
Third Grade
Data and Graphing
Activity
The Statistics of Sunspots
Activity
The Statistics of Sunspots
Engineering and Science Inquiry
This experiment will explore how manipulating a graph of historical information might reveal new information about data.
Activity
The Statistics of Sunspots
Activity
The Statistics of Sunspots
This experiment will explore how manipulating a graph of historical information might reveal new information about data.
Engineering and Science Inquiry
Activity
Evaluating Benford’s Law
Activity
Evaluating Benford’s Law
Engineering and Science Inquiry
In this science fair project, students investigate the applicability of Benford's Law to many sets of everyday data.
Activity
Evaluating Benford’s Law
Activity
Evaluating Benford’s Law
In this science fair project, students investigate the applicability of Benford's Law to many sets of everyday data.
Engineering and Science Inquiry
Activity
Play Graphing Battleship
Activity
Play Graphing Battleship
Practice plotting points on a graph when learning is wrapped up in a game. This one will help your child practice the concept of ordered pairs.
Activity
Play Graphing Battleship
Activity
Play Graphing Battleship
Practice plotting points on a graph when learning is wrapped up in a game. This one will help your child practice the concept of ordered pairs.
Activity
Make a Temperature Tracker
Activity
Make a Temperature Tracker
Fifth Grade
Geometry
Here's a fun at-home activity that will help your child strengthen math skills using high and low temperature data, and become a master temperature tracker!
Activity
Make a Temperature Tracker
Activity
Make a Temperature Tracker
Here's a fun at-home activity that will help your child strengthen math skills using high and low temperature data, and become a master temperature tracker!
Fifth Grade
Geometry
Activity
Encoding Digital Images
Activity
Encoding Digital Images
Engineering and Science Inquiry
Science fair project about different digital image file types, compares different encoding algorithms used to compress the data.
Activity
Encoding Digital Images
Activity
Encoding Digital Images
Science fair project about different digital image file types, compares different encoding algorithms used to compress the data.
Engineering and Science Inquiry
Activity
Learn to Graph with a Backyard Tournament
Activity
Learn to Graph with a Backyard Tournament
First Grade
Data and Graphing
Gather the neighborhood children together and practice graphing with this backyard tournament!
Activity
Learn to Graph with a Backyard Tournament
Activity
Learn to Graph with a Backyard Tournament
Gather the neighborhood children together and practice graphing with this backyard tournament!
First Grade
Data and Graphing
Activity
Step Up to the Percentage Plate
Activity
Step Up to the Percentage Plate
Fifth Grade
Here's a fun at-home activity that will help your child strengthen his ability to work with and interpret data in various forms.
Activity
Step Up to the Percentage Plate
Activity
Step Up to the Percentage Plate
Here's a fun at-home activity that will help your child strengthen his ability to work with and interpret data in various forms.
Fifth Grade
Activity
Using Statistics to Predict Relationship Success or Failure
Activity
Using Statistics to Predict Relationship Success or Failure
Engineering and Science Inquiry
Students identify variables that affect the duration of high school romances and analyze data to predict the success or failure of ongoing relationships.
Activity
Using Statistics to Predict Relationship Success or Failure
Activity
Using Statistics to Predict Relationship Success or Failure
Students identify variables that affect the duration of high school romances and analyze data to predict the success or failure of ongoing relationships.
Engineering and Science Inquiry
Activity
Efficient Multi-tasking
Activity
Efficient Multi-tasking
Engineering and Science Inquiry
Determine the efficiency of multi-tasking by comparing how long it takes students to complete different tasks. Collate data, complete Summary Chart.
Activity
Efficient Multi-tasking
Activity
Efficient Multi-tasking
Determine the efficiency of multi-tasking by comparing how long it takes students to complete different tasks. Collate data, complete Summary Chart.
Engineering and Science Inquiry
Activity
Fuel Efficiency
Activity
Fuel Efficiency
Engineering and Science Inquiry
Science fair project idea that measures fuel efficiency in cars. Calculate cost per mile by comparing fuel cost and consumption data.
Activity
Fuel Efficiency
Activity
Fuel Efficiency
Science fair project idea that measures fuel efficiency in cars. Calculate cost per mile by comparing fuel cost and consumption data.
Engineering and Science Inquiry
Activity
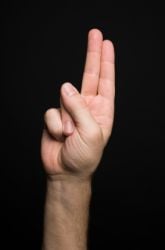
The Effect of Repetition in Sign Language Acquisition in Infants
Activity
The Effect of Repetition in Sign Language Acquisition in Infants
Writing
This science fair project idea provide quantitative data about how well the use of ASL ( American Sign Language) works in communicating with babies.
Activity
The Effect of Repetition in Sign Language Acquisition in Infants
Activity
The Effect of Repetition in Sign Language Acquisition in Infants
This science fair project idea provide quantitative data about how well the use of ASL ( American Sign Language) works in communicating with babies.
Writing
Activity
The New You
Activity
The New You
Engineering and Science Inquiry
Devise an argument for or against the possibility of resurrectin extinct species through DNA manipulation. Analyze data, report findings.
Activity
The New You
Activity
The New You
Devise an argument for or against the possibility of resurrectin extinct species through DNA manipulation. Analyze data, report findings.
Engineering and Science Inquiry
Activity
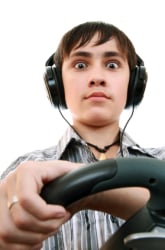
Video Driver
Activity
Video Driver
Engineering and Science Inquiry
Create groups of volunteers based on frequency of playing video games. Compare driving records. Analyze data, interpret findings.
Activity
Video Driver
Activity
Video Driver
Create groups of volunteers based on frequency of playing video games. Compare driving records. Analyze data, interpret findings.
Engineering and Science Inquiry
Activity
Genes
Activity
Genes
Engineering and Science Inquiry
Study and categorize the functions and types of genes. Run gene experiments chosen from links. Analyze data, explain ideas in a detailed report.
Activity
Genes
Activity
Genes
Study and categorize the functions and types of genes. Run gene experiments chosen from links. Analyze data, explain ideas in a detailed report.
Engineering and Science Inquiry
Activity
Graph Money
Activity
Graph Money
Second Grade
Data and Graphing
Give your smart second grader a rich challenge with this activity that combines graphing practice with money!
Activity
Graph Money
Activity
Graph Money
Give your smart second grader a rich challenge with this activity that combines graphing practice with money!
Second Grade
Data and Graphing
Activity
Finding Absolute Zero
Activity
Finding Absolute Zero
Measurement
What is the coldest temperature possible? In this cool experiment, you'll calculate absolute zero by extrapolating data on the temperature and volume of gas.
Activity
Finding Absolute Zero
Activity
Finding Absolute Zero
What is the coldest temperature possible? In this cool experiment, you'll calculate absolute zero by extrapolating data on the temperature and volume of gas.
Measurement
Activity
Smell & Taste
Activity
Smell & Taste
Fourth Grade
Life Science
Experiment about connection of senses of taste and smell. Using blindfold and noseplugs, administer blind taste test. Analyze results and organize data.
Activity
Smell & Taste
Activity
Smell & Taste
Experiment about connection of senses of taste and smell. Using blindfold and noseplugs, administer blind taste test. Analyze results and organize data.
Fourth Grade
Life Science
Activity
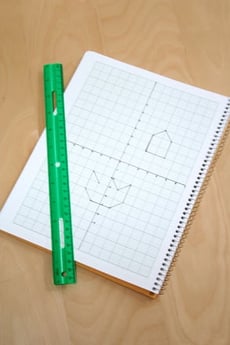
Solve a Graph Puzzle
Activity
Solve a Graph Puzzle
Fifth Grade
Data and Graphing
Here's a fun, geometric puzzle activity that will capture your child's interest and strengthen his number awareness and graphing skills.
Activity
Solve a Graph Puzzle
Activity
Solve a Graph Puzzle
Here's a fun, geometric puzzle activity that will capture your child's interest and strengthen his number awareness and graphing skills.
Fifth Grade
Data and Graphing
Activity
Make a Family Fridge Graph
Activity
Make a Family Fridge Graph
First Grade
Data and Graphing
Make a fun refrigerator graph with your first grader in order to help her develop those crucial graphing skills, while engaging with the whole family.
Activity
Make a Family Fridge Graph
Activity
Make a Family Fridge Graph
Make a fun refrigerator graph with your first grader in order to help her develop those crucial graphing skills, while engaging with the whole family.
First Grade
Data and Graphing
Activity
Growing Garden Pictograph
Activity
Growing Garden Pictograph
Kindergarten
Measurement
Try this fun garden graphing project with your kindergartener this summer to give him a leg up in math and science while spending some valuable time outdoors!
Activity
Growing Garden Pictograph
Activity
Growing Garden Pictograph
Try this fun garden graphing project with your kindergartener this summer to give him a leg up in math and science while spending some valuable time outdoors!
Kindergarten
Measurement
Activity
Study of Names
Activity
Study of Names
Third Grade
Data and Graphing
Graph are a great way to organize information. Your child will get to practice graphing by creating a bar graph and a pictorial graph of her friend's names.
Activity
Study of Names
Activity
Study of Names
Graph are a great way to organize information. Your child will get to practice graphing by creating a bar graph and a pictorial graph of her friend's names.
Third Grade
Data and Graphing
Activity
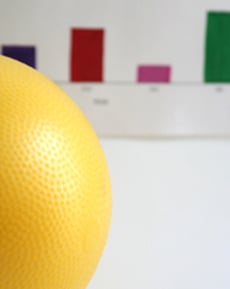
Bounce that Ball: Learn Math While Doing Sports
Activity
Bounce that Ball: Learn Math While Doing Sports
First Grade
Data and Graphing
Head out to the driveway, ball in hand, for a bouncing challenge. Then use those results to make a colorful graph that lets your child compare results.
Activity
Bounce that Ball: Learn Math While Doing Sports
Activity
Bounce that Ball: Learn Math While Doing Sports
Head out to the driveway, ball in hand, for a bouncing challenge. Then use those results to make a colorful graph that lets your child compare results.
First Grade
Data and Graphing
Activity
Track the Weather with Weather Charts
Activity
Track the Weather with Weather Charts
Third Grade
Measurement
Learn about the microclimate of your backyard by tracking rainfall, temperature, and observed weather with hand drawn charts and graphs.
Activity
Track the Weather with Weather Charts
Activity
Track the Weather with Weather Charts
Learn about the microclimate of your backyard by tracking rainfall, temperature, and observed weather with hand drawn charts and graphs.
Third Grade
Measurement
Activity
Mathematical Modeling of Bacterial Growth
Activity
Mathematical Modeling of Bacterial Growth
Measurement
In this science fair experiment, high school students fit the growth pattern of bacteria to a mathematical model and predict future colony expansion.
Activity
Mathematical Modeling of Bacterial Growth
Activity
Mathematical Modeling of Bacterial Growth
In this science fair experiment, high school students fit the growth pattern of bacteria to a mathematical model and predict future colony expansion.
Measurement
Activity
Soccer Physics: Does the Amount of Air Inside the Ball Affect How Far It Goes?
Activity
Soccer Physics: Does the Amount of Air Inside the Ball Affect How Far It Goes?
Engineering and Science Inquiry
The purpose of this science project is to determine whether the amount of air in a soccer ball affects how far it goes when kicked.
Activity
Soccer Physics: Does the Amount of Air Inside the Ball Affect How Far It Goes?
Activity
Soccer Physics: Does the Amount of Air Inside the Ball Affect How Far It Goes?
The purpose of this science project is to determine whether the amount of air in a soccer ball affects how far it goes when kicked.
Engineering and Science Inquiry
Activity
1
2
3
4
…
19