Bar Graphs Resources
115 results
Math
✕Sort by:
115 results
Sort by:


About Bar Graphs Resources
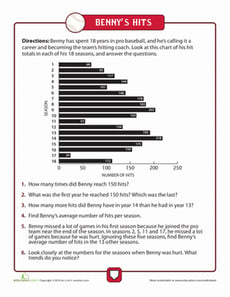
On Education.com, bar graphs are visual tools that describe data by displaying quantities as heights of rectangular bars. They help students quickly compare different sets of numbers and understand patterns and relationships within data.
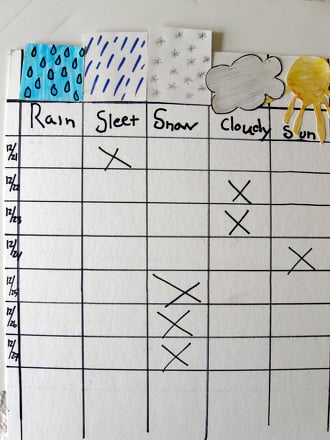
This page offers a selection of printable bar graph worksheets, hands-on activities, and interactive exercises for learners in primary and elementary grades. These resources support data collection, chart interpretation, and communication skills, aligned with educational standards. Educators and parents can use these materials to reinforce math concepts, encourage critical thinking, and make learning engaging.
Using these lesson plans and activities, teachers can guide students through creating their own bar graphs, analyzing data sets, and drawing conclusions visually. Parents can reinforce classroom lessons at home with structured worksheets that enhance problem-solving abilities and data literacy. These resources save on preparation time while providing structured, educational content that builds foundational mathematical skills.