SKIP TO CONTENT
Worksheet Generator
Subjects
Grades
Worksheets
Games
Build a Worksheet
More Resources
Roly Recommends
Subjects
Grades
Worksheets
Games
Build a Worksheet
More Resources
Roly Recommends
Filters
Search for: data, graphing
✕
1st - 3rd Grade
✕
Subjects
Math
English Language Arts
Science
Social Studies
Grade Level
Pre-K
K
1st
2nd
3rd
4th
5th
6th
7th
8th
Early Childhood
Elementary School
Middle School
Resource Type
Worksheets
Games
Lesson Plans
Interactive Worksheets
Workbooks
Activities
Exercises
Songs
Offline Games
Guided Lessons
Teacher Resources
See more
Occasion
Birthdays
Summer
Back to School
Halloween
Holidays
Hanukkah
Valentine's Day
Common Core
Yes
Game Type
Ball Games
Word Puzzles
English Language Support
Yes
See More
Clear All
View 317 results
Showing Results for data graphing : Page 5
317 results
Search for: data, graphing
✕
1st - 3rd Grade
✕
Clear All
Sort by:
Relevance
Most recent
Most popular
Alphabetical A-Z
Alphabetical Z-A
All filters
317 results
Sort by:
Relevance
Most recent
Most popular
Alphabetical A-Z
Alphabetical Z-A
Word Problems and Graphing
Exercise
Word Problems and Graphing
Third Grade
Math
Students will be able to translate word problems into various types of graphs after completing this exercise.
Exercise
Word Problems and Graphing
Exercise
Word Problems and Graphing
Students will be able to translate word problems into various types of graphs after completing this exercise.
Third Grade
Math
Exercise
Geography Math
Workbook
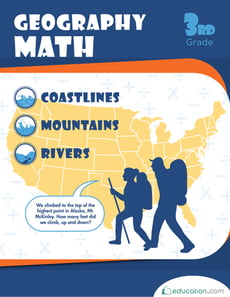
Geography Math
Third Grade
Geography
Scale math heights using this workbook that's based on real measurements of U.S. geography. Kids rely on charts and data provided to answer word problems.
Workbook
Geography Math
Workbook
Geography Math
Scale math heights using this workbook that's based on real measurements of U.S. geography. Kids rely on charts and data provided to answer word problems.
Third Grade
Geography
Workbook
Collect, Organize, Display, Analyze
Lesson Plan
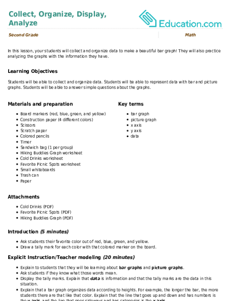
Collect, Organize, Display, Analyze
Second Grade
In this lesson, your students will collect and organize data to make a beautiful bar graph! They will also practice analyzing the graphs with the information they have.
Lesson Plan
Collect, Organize, Display, Analyze
Lesson Plan
Collect, Organize, Display, Analyze
In this lesson, your students will collect and organize data to make a beautiful bar graph! They will also practice analyzing the graphs with the information they have.
Second Grade
Lesson Plan
How to Make a Bar Graph with BBQ Food
Worksheet
How to Make a Bar Graph with BBQ Food
Second Grade
Data and Graphing
Great food never goes out of style. Find out what the most popular barbecue foods are with this bar graph that teaches kids how to interpret data.
Worksheet
How to Make a Bar Graph with BBQ Food
Worksheet
How to Make a Bar Graph with BBQ Food
Great food never goes out of style. Find out what the most popular barbecue foods are with this bar graph that teaches kids how to interpret data.
Second Grade
Data and Graphing
Worksheet
What Do We Know About Pets?
Worksheet
What Do We Know About Pets?
First Grade
Data and Graphing
Ms. Martin collected data about her class' favorite pets. Ask your students to use the bar graph with Ms. Martin's findings to answer the questions on the worksheet.
Worksheet
What Do We Know About Pets?
Worksheet
What Do We Know About Pets?
Ms. Martin collected data about her class' favorite pets. Ask your students to use the bar graph with Ms. Martin's findings to answer the questions on the worksheet.
First Grade
Data and Graphing
Worksheet
Measuring the Length of Books
Worksheet
Measuring the Length of Books
Third Grade
Fractions
Use this worksheet to give your students practice measuring books to the nearest quarter of an inch and an opportunity to turn their data into a line plot.
Worksheet
Measuring the Length of Books
Worksheet
Measuring the Length of Books
Use this worksheet to give your students practice measuring books to the nearest quarter of an inch and an opportunity to turn their data into a line plot.
Third Grade
Fractions
Worksheet
Making a Graph: Andy's Safari
Worksheet
Making a Graph: Andy's Safari
Second Grade
Data and Graphing
Give your second grader a fun way to practice reading and using graphs, as well as practice basic arithmetic with this graphing worksheet.
Worksheet
Making a Graph: Andy's Safari
Worksheet
Making a Graph: Andy's Safari
Give your second grader a fun way to practice reading and using graphs, as well as practice basic arithmetic with this graphing worksheet.
Second Grade
Data and Graphing
Worksheet
Pictographs: Say Cheese!
Worksheet
Pictographs: Say Cheese!
Third Grade
Data and Graphing
To keep track of his cheese sales, Giovanni uses a pictograph. Kids will figure out how his cheese business is doing by using data in the graph.
Worksheet
Pictographs: Say Cheese!
Worksheet
Pictographs: Say Cheese!
To keep track of his cheese sales, Giovanni uses a pictograph. Kids will figure out how his cheese business is doing by using data in the graph.
Third Grade
Data and Graphing
Worksheet
Go Runners! Practice Reading a Bar Graph
Worksheet
Go Runners! Practice Reading a Bar Graph
Third Grade
Data and Graphing
Your child will practice reading and interpreting a bar graph and using its data to answer a set of questions in this 3rd grade math worksheet.
Worksheet
Go Runners! Practice Reading a Bar Graph
Worksheet
Go Runners! Practice Reading a Bar Graph
Your child will practice reading and interpreting a bar graph and using its data to answer a set of questions in this 3rd grade math worksheet.
Third Grade
Data and Graphing
Worksheet
Interpreting Line Plots, Bar Graphs and Picture Graphs: Word Problems
Lesson Plan
Interpreting Line Plots, Bar Graphs and Picture Graphs: Word Problems
Third Grade
Graphs bring data to life and help us draw conclusions about the information. In this lesson, students will engage with three different kinds of graphs by asking and answering interpretive questions.
Lesson Plan
Interpreting Line Plots, Bar Graphs and Picture Graphs: Word Problems
Lesson Plan
Interpreting Line Plots, Bar Graphs and Picture Graphs: Word Problems
Graphs bring data to life and help us draw conclusions about the information. In this lesson, students will engage with three different kinds of graphs by asking and answering interpretive questions.
Third Grade
Lesson Plan
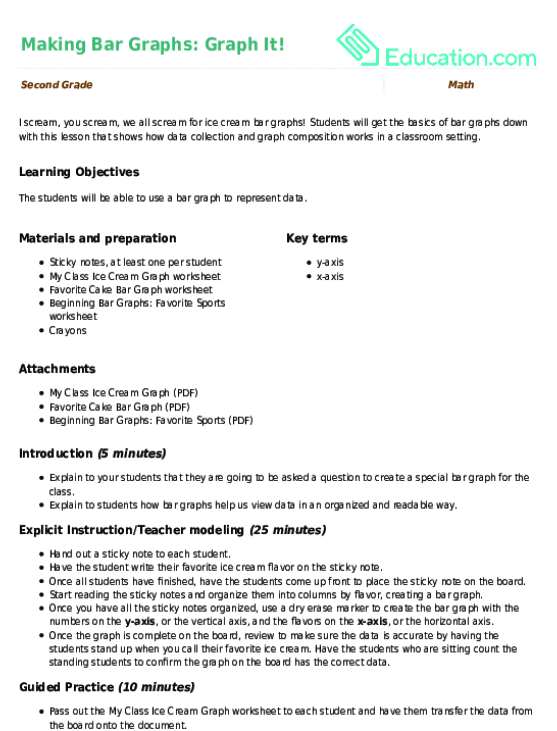
Making Bar Graphs: Graph It!
Lesson Plan
Making Bar Graphs: Graph It!
Second Grade
I scream, you scream, we all scream for ice cream bar graphs! Students will get the basics of bar graphs down with this lesson that shows how data collection and graph composition works in a classroom setting.
Lesson Plan
Making Bar Graphs: Graph It!
Lesson Plan
Making Bar Graphs: Graph It!
I scream, you scream, we all scream for ice cream bar graphs! Students will get the basics of bar graphs down with this lesson that shows how data collection and graph composition works in a classroom setting.
Second Grade
Lesson Plan
Graph Money
Activity
Graph Money
Second Grade
Data and Graphing
Give your smart second grader a rich challenge with this activity that combines graphing practice with money!
Activity
Graph Money
Activity
Graph Money
Give your smart second grader a rich challenge with this activity that combines graphing practice with money!
Second Grade
Data and Graphing
Activity
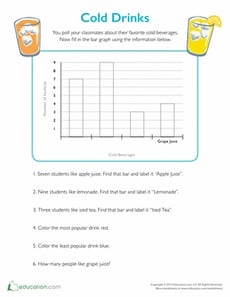
Cold Drinks Bar Graph
Worksheet
Cold Drinks Bar Graph
Second Grade
Data and Graphing
Use an easy bar graph to find out what your classmates' favorite cold drinks are. Kids will get the chance to analyze data and color in the bar graph.
Worksheet
Cold Drinks Bar Graph
Worksheet
Cold Drinks Bar Graph
Use an easy bar graph to find out what your classmates' favorite cold drinks are. Kids will get the chance to analyze data and color in the bar graph.
Second Grade
Data and Graphing
Worksheet
How Big is the Playground?
Lesson Plan
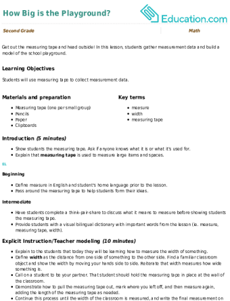
How Big is the Playground?
Second Grade
Vocabulary
Get out the measuring tape and head outside! In this lesson, students gather measurement data and build a model of the school playground.
Lesson Plan
How Big is the Playground?
Lesson Plan
How Big is the Playground?
Get out the measuring tape and head outside! In this lesson, students gather measurement data and build a model of the school playground.
Second Grade
Vocabulary
Lesson Plan
Understanding Line Plots
Lesson Plan
Understanding Line Plots
Second Grade
Writing
This lesson provides students with the opportunity to critically think about data. Use this lesson alongside Line Plots: Representing the Length of Classroom Items or as a stand alone lesson.
Lesson Plan
Understanding Line Plots
Lesson Plan
Understanding Line Plots
This lesson provides students with the opportunity to critically think about data. Use this lesson alongside Line Plots: Representing the Length of Classroom Items or as a stand alone lesson.
Second Grade
Writing
Lesson Plan
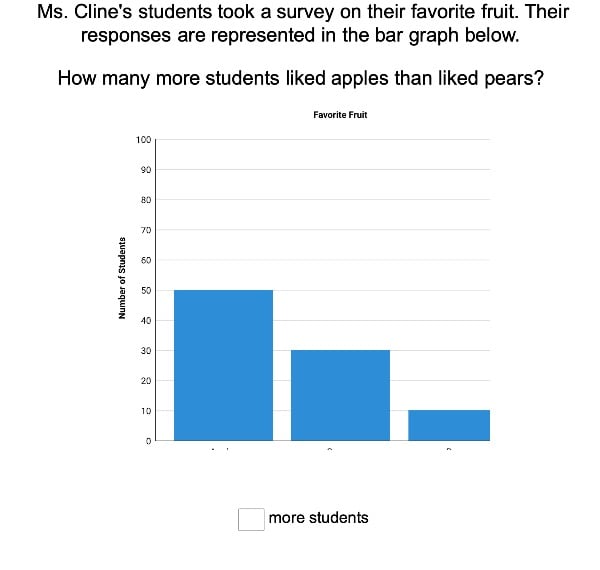
How Many More?
Lesson Plan
How Many More?
Second Grade
Subtraction is a lot more than just “take away.” In this lesson, students develop an understanding of subtraction as comparison by creating and interpreting data from bar graphs.
Lesson Plan
How Many More?
Lesson Plan
How Many More?
Subtraction is a lot more than just “take away.” In this lesson, students develop an understanding of subtraction as comparison by creating and interpreting data from bar graphs.
Second Grade
Lesson Plan
Making Sweet Line Graphs!
Worksheet
Making Sweet Line Graphs!
Second Grade
Data and Graphing
Satisfy your sweet tooth, and practice graphing at the same time! Practice making a line graph using the information given.
Worksheet
Making Sweet Line Graphs!
Worksheet
Making Sweet Line Graphs!
Satisfy your sweet tooth, and practice graphing at the same time! Practice making a line graph using the information given.
Second Grade
Data and Graphing
Worksheet
Line Plots: Representing the Length of Classroom Items
Lesson Plan
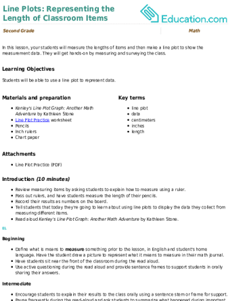
Line Plots: Representing the Length of Classroom Items
Second Grade
Measurement
In this lesson, your students will measure the lengths of items and then make a line plot to show the measurement data. They will get hands-on by measuring and surveying the class.
Lesson Plan
Line Plots: Representing the Length of Classroom Items
Lesson Plan
Line Plots: Representing the Length of Classroom Items
In this lesson, your students will measure the lengths of items and then make a line plot to show the measurement data. They will get hands-on by measuring and surveying the class.
Second Grade
Measurement
Lesson Plan
Different Types of Graphs: Picture and Bar Graphs
Worksheet
Different Types of Graphs: Picture and Bar Graphs
First Grade
Data and Graphing
Sure to test your kid's graphing skills, this graph worksheet features two different types of graphs and questions to go along with them.
Worksheet
Different Types of Graphs: Picture and Bar Graphs
Worksheet
Different Types of Graphs: Picture and Bar Graphs
Sure to test your kid's graphing skills, this graph worksheet features two different types of graphs and questions to go along with them.
First Grade
Data and Graphing
Worksheet
Let's Interpret the Line Plot
Lesson Plan
Let's Interpret the Line Plot
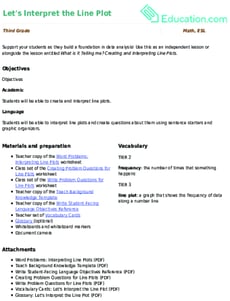
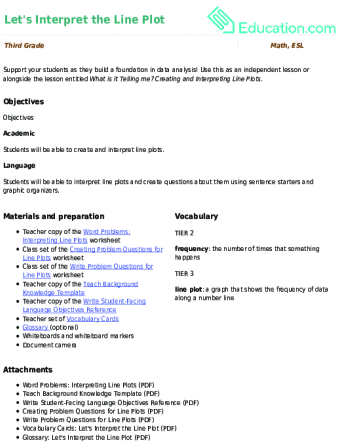
Third Grade
Support your students as they build a foundation in data analysis! Use this as an independent lesson or alongside the lesson entitled
What is it Telling me? Creating and Interpreting Line Plots.
Lesson Plan
Let's Interpret the Line Plot
Lesson Plan
Let's Interpret the Line Plot
Support your students as they build a foundation in data analysis! Use this as an independent lesson or alongside the lesson entitled
What is it Telling me? Creating and Interpreting Line Plots.
Third Grade
Lesson Plan
Reading Pictographs: Drink Your Milk!
Worksheet
Reading Pictographs: Drink Your Milk!
Third Grade
Data and Graphing
Can your child help Tommy figure out how much milk he drinks? As she does, she'll learn how to read and interpret data in graphs and practice multiplication.
Worksheet
Reading Pictographs: Drink Your Milk!
Worksheet
Reading Pictographs: Drink Your Milk!
Can your child help Tommy figure out how much milk he drinks? As she does, she'll learn how to read and interpret data in graphs and practice multiplication.
Third Grade
Data and Graphing
Worksheet
Math + Love = Valentine's Day Bar Graph
Lesson Plan
Math + Love = Valentine's Day Bar Graph
Second Grade
Data and Graphing
What's more romantic than a bar graph on Valentine's Day? In this Valentine's Day lesson plan, students will use information from a data set to create their own tally charts and bar graphs and then analyze these graphs to answer questions.
Lesson Plan
Math + Love = Valentine's Day Bar Graph
Lesson Plan
Math + Love = Valentine's Day Bar Graph
What's more romantic than a bar graph on Valentine's Day? In this Valentine's Day lesson plan, students will use information from a data set to create their own tally charts and bar graphs and then analyze these graphs to answer questions.
Second Grade
Data and Graphing
Lesson Plan
Foot Length Line Plot
Worksheet
Foot Length Line Plot
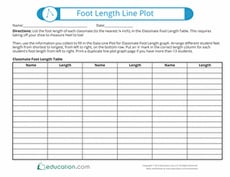
Third Grade
Fractions
One foot is 12 inches long, but how many inches long is the foot connected to your body? Using this resource, your class will measure their classmates' foot sizes and graph the data on a line plot.
Worksheet
Foot Length Line Plot
Worksheet
Foot Length Line Plot
One foot is 12 inches long, but how many inches long is the foot connected to your body? Using this resource, your class will measure their classmates' foot sizes and graph the data on a line plot.
Third Grade
Fractions
Worksheet
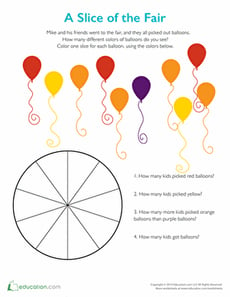
A Slice of the Fair: Pie Chart for Kids
Worksheet
A Slice of the Fair: Pie Chart for Kids
Second Grade
Data and Graphing
Who doesn't love a slice of pie and balloons? Color the different slices in this pie chart for kids to learn more about graphing.
Worksheet
A Slice of the Fair: Pie Chart for Kids
Worksheet
A Slice of the Fair: Pie Chart for Kids
Who doesn't love a slice of pie and balloons? Color the different slices in this pie chart for kids to learn more about graphing.
Second Grade
Data and Graphing
Worksheet
Making Measurements for Line Plots
Lesson Plan
Making Measurements for Line Plots
Third Grade
In this hands-on lesson, your students will get to sharpen their measuring skills as they measure lengths of items in your classroom to the nearest quarter inch. They'll get to then use their data to create line plots.
Lesson Plan
Making Measurements for Line Plots
Lesson Plan
Making Measurements for Line Plots
In this hands-on lesson, your students will get to sharpen their measuring skills as they measure lengths of items in your classroom to the nearest quarter inch. They'll get to then use their data to create line plots.
Third Grade
Lesson Plan
Reading Pictographs: Going to the Theater
Worksheet
Reading Pictographs: Going to the Theater
Third Grade
Data and Graphing
In this 3rd grade math worksheet, kids practice interpreting graph data as they use the information in a pictograph to answer a set of questions.
Worksheet
Reading Pictographs: Going to the Theater
Worksheet
Reading Pictographs: Going to the Theater
In this 3rd grade math worksheet, kids practice interpreting graph data as they use the information in a pictograph to answer a set of questions.
Third Grade
Data and Graphing
Worksheet
Asking and Answering Questions about Line Plots and Bar Graphs
Lesson Plan
Asking and Answering Questions about Line Plots and Bar Graphs
Third Grade
Take students’ understanding of bar graphs and line plots to the next level. This lesson will encourage students to think about how graphs are designed and the questions we can ask and answer about data presented in graphs.
Lesson Plan
Asking and Answering Questions about Line Plots and Bar Graphs
Lesson Plan
Asking and Answering Questions about Line Plots and Bar Graphs
Take students’ understanding of bar graphs and line plots to the next level. This lesson will encourage students to think about how graphs are designed and the questions we can ask and answer about data presented in graphs.
Third Grade
Lesson Plan
Make a Family Fridge Graph
Activity
Make a Family Fridge Graph
First Grade
Data and Graphing
Make a fun refrigerator graph with your first grader in order to help her develop those crucial graphing skills, while engaging with the whole family.
Activity
Make a Family Fridge Graph
Activity
Make a Family Fridge Graph
Make a fun refrigerator graph with your first grader in order to help her develop those crucial graphing skills, while engaging with the whole family.
First Grade
Data and Graphing
Activity
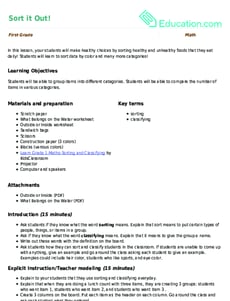
Sort it Out!
Lesson Plan
Sort it Out!
First Grade
In this lesson, your students will make healthy choices by sorting healthy and unhealthy foods that they eat daily! Students will learn to sort data by color and many more categories!
Lesson Plan
Sort it Out!
Lesson Plan
Sort it Out!
In this lesson, your students will make healthy choices by sorting healthy and unhealthy foods that they eat daily! Students will learn to sort data by color and many more categories!
First Grade
Lesson Plan
Reading Log and Graph
Worksheet
Reading Log and Graph
Second Grade
Data and Graphing
Keeping a reading log is a great way to encourage your child to set goals and track their progress. Your students will build reading fluency and stamina by logging and graphing their reading time.
Worksheet
Reading Log and Graph
Worksheet
Reading Log and Graph
Keeping a reading log is a great way to encourage your child to set goals and track their progress. Your students will build reading fluency and stamina by logging and graphing their reading time.
Second Grade
Data and Graphing
Worksheet
1
…
4
5
6
…
11