SKIP TO CONTENT
Worksheet Generator
Subjects
Grades
Worksheets
Games
Build a Worksheet
More Resources
Roly Recommends
Subjects
Grades
Worksheets
Games
Build a Worksheet
More Resources
Roly Recommends
All Subjects
Math
Data and Graphing
Subtopics:
Collecting and Organizing Data
Picture Graphs
Bar Graphs
Coordinate Plane
Show Less
Filters
Search for: two, digit, using, place, value
✕
Math
✕
1st - 3rd Grade
✕
Subjects
Math
English Language Arts
Science
Social Studies
Foreign Language
Grade Level
Pre-K
K
1st
2nd
3rd
4th
5th
6th
7th
8th
Early Childhood
Elementary School
Middle School
Resource Type
Worksheets
Games
Lesson Plans
Interactive Worksheets
Activities
Offline Games
Guided Lessons
Occasion
Birthdays
St. Patrick's Day
Summer
Halloween
Holidays
Common Core
Yes
Game Type
Ball Games
Arts & Crafts
Arts & Crafts
Paper & Glue Crafts
English Language Support
Yes
See More
Clear All
View 93 results
Showing Results for two digit using place value : Page 2
93 results
Search for: two, digit, using, place, value
✕
Math
✕
1st - 3rd Grade
✕
Clear All
Sort by:
Relevance
Most recent
Most popular
Alphabetical A-Z
Alphabetical Z-A
All filters
93 results
Sort by:
Relevance
Most recent
Most popular
Alphabetical A-Z
Alphabetical Z-A
Graphing Data: Colors
Worksheet
Graphing Data: Colors
Second Grade
Data and Graphing
Help the concept of graphing really sink in by challenging your second grader to graph kids' favorite colors using a table, tally mark table, and grid.
Worksheet
Graphing Data: Colors
Worksheet
Graphing Data: Colors
Help the concept of graphing really sink in by challenging your second grader to graph kids' favorite colors using a table, tally mark table, and grid.
Second Grade
Data and Graphing
Worksheet
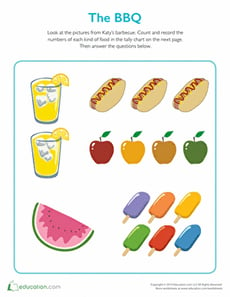
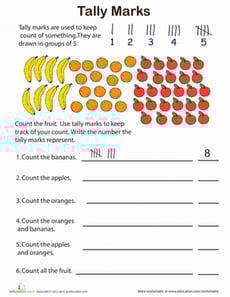
The BBQ Tally
Worksheet
The BBQ Tally
Second Grade
Data and Graphing
Your student will use the colorful pictures to count the number of food items that were consumed and record the information using the tally chart provided.
Worksheet
The BBQ Tally
Worksheet
The BBQ Tally
Your student will use the colorful pictures to count the number of food items that were consumed and record the information using the tally chart provided.
Second Grade
Data and Graphing
Worksheet
Word Problems: Interpreting Line Plots
Worksheet
Word Problems: Interpreting Line Plots
Second Grade
Data and Graphing
Students will have a chance to practice solving word problems using line plots with this worksheet.
Worksheet
Word Problems: Interpreting Line Plots
Worksheet
Word Problems: Interpreting Line Plots
Students will have a chance to practice solving word problems using line plots with this worksheet.
Second Grade
Data and Graphing
Worksheet
Ice Cream Bar Graph #10
Worksheet
Ice Cream Bar Graph #10
First Grade
Data and Graphing
Sam, Kate, and Becky need help keeping track of their ice cream sales. Practice using bar graphs, addition, and subtraction in this ice cream themed worksheet.
Worksheet
Ice Cream Bar Graph #10
Worksheet
Ice Cream Bar Graph #10
Sam, Kate, and Becky need help keeping track of their ice cream sales. Practice using bar graphs, addition, and subtraction in this ice cream themed worksheet.
First Grade
Data and Graphing
Worksheet
Go Runners! Practice Reading a Bar Graph
Worksheet
Go Runners! Practice Reading a Bar Graph
Third Grade
Data and Graphing
Your child will practice reading and interpreting a bar graph and using its data to answer a set of questions in this 3rd grade math worksheet.
Worksheet
Go Runners! Practice Reading a Bar Graph
Worksheet
Go Runners! Practice Reading a Bar Graph
Your child will practice reading and interpreting a bar graph and using its data to answer a set of questions in this 3rd grade math worksheet.
Third Grade
Data and Graphing
Worksheet
Pictographs: Say Cheese!
Worksheet
Pictographs: Say Cheese!
Third Grade
Data and Graphing
To keep track of his cheese sales, Giovanni uses a pictograph. Kids will figure out how his cheese business is doing by using data in the graph.
Worksheet
Pictographs: Say Cheese!
Worksheet
Pictographs: Say Cheese!
To keep track of his cheese sales, Giovanni uses a pictograph. Kids will figure out how his cheese business is doing by using data in the graph.
Third Grade
Data and Graphing
Worksheet
Graph My Design
Lesson Plan
Graph My Design
First Grade
Geometry
Geometry meets data in this fun lesson! Students will build a design using pattern blocks and then graph the number of each shape used. This scaffolded EL lesson can be used alone or alongside
Graphing Colored Counters.
Lesson Plan
Graph My Design
Lesson Plan
Graph My Design
Geometry meets data in this fun lesson! Students will build a design using pattern blocks and then graph the number of each shape used. This scaffolded EL lesson can be used alone or alongside
Graphing Colored Counters.
First Grade
Geometry
Lesson Plan
Making Sweet Line Graphs!
Worksheet
Making Sweet Line Graphs!
Second Grade
Data and Graphing
Satisfy your sweet tooth, and practice graphing at the same time! Practice making a line graph using the information given.
Worksheet
Making Sweet Line Graphs!
Worksheet
Making Sweet Line Graphs!
Satisfy your sweet tooth, and practice graphing at the same time! Practice making a line graph using the information given.
Second Grade
Data and Graphing
Worksheet
Tally Marks: Keep the Count!
Worksheet
Tally Marks: Keep the Count!
Second Grade
Data and Graphing
Help your second grader practice using tally marks with this worksheet, and next family game night, she can keep score!
Worksheet
Tally Marks: Keep the Count!
Worksheet
Tally Marks: Keep the Count!
Help your second grader practice using tally marks with this worksheet, and next family game night, she can keep score!
Second Grade
Data and Graphing
Worksheet
Bar Graphs: Interpreting Data
Lesson Plan
Bar Graphs: Interpreting Data
Second Grade
Data and Graphing
In this lesson, students will make bar graphs and interpret data using real-life data from other students. They will get practice writing and answering survey questions.
Lesson Plan
Bar Graphs: Interpreting Data
Lesson Plan
Bar Graphs: Interpreting Data
In this lesson, students will make bar graphs and interpret data using real-life data from other students. They will get practice writing and answering survey questions.
Second Grade
Data and Graphing
Lesson Plan
Bar Graphing with Eggs
Game
Bar Graphing with Eggs
Third Grade
Data and Graphing
It's raining eggs! Kids must move quickly to catch eggs for Farmer Brown, organizing and displaying the data using bar graphs in this silly game.
Game
Bar Graphing with Eggs
Game
Bar Graphing with Eggs
It's raining eggs! Kids must move quickly to catch eggs for Farmer Brown, organizing and displaying the data using bar graphs in this silly game.
Third Grade
Data and Graphing
Game
Less Than or Greater Than: 1 to 20
Game
Less Than or Greater Than: 1 to 20
First Grade
Numbers and Counting
The alligators are hungry for numbers, and kids use number skills to feed them.
Game
Less Than or Greater Than: 1 to 20
Game
Less Than or Greater Than: 1 to 20
The alligators are hungry for numbers, and kids use number skills to feed them.
First Grade
Numbers and Counting
Game
Basic Pictographs
Worksheet
Basic Pictographs
First Grade
Data and Graphing
Practice adding multiple digits with a fun pictograph page. Use the chart to draw out the number of items in each problem.
Worksheet
Basic Pictographs
Worksheet
Basic Pictographs
Practice adding multiple digits with a fun pictograph page. Use the chart to draw out the number of items in each problem.
First Grade
Data and Graphing
Worksheet
Addition Picture Graphs
Worksheet
Addition Picture Graphs
First Grade
Data and Graphing
Explore some stellar math concepts with this worksheet on adding multiple digits. Fill in the pictograph to help you visualize the problem first.
Worksheet
Addition Picture Graphs
Worksheet
Addition Picture Graphs
Explore some stellar math concepts with this worksheet on adding multiple digits. Fill in the pictograph to help you visualize the problem first.
First Grade
Data and Graphing
Worksheet
Bounce that Ball: Learn Math While Doing Sports
Activity
Bounce that Ball: Learn Math While Doing Sports
First Grade
Data and Graphing
Head out to the driveway, ball in hand, for a bouncing challenge. Then use those results to make a colorful graph that lets your child compare results.
Activity
Bounce that Ball: Learn Math While Doing Sports
Activity
Bounce that Ball: Learn Math While Doing Sports
Head out to the driveway, ball in hand, for a bouncing challenge. Then use those results to make a colorful graph that lets your child compare results.
First Grade
Data and Graphing
Activity
Graph Money
Activity
Graph Money
Second Grade
Data and Graphing
Give your smart second grader a rich challenge with this activity that combines graphing practice with money!
Activity
Graph Money
Activity
Graph Money
Give your smart second grader a rich challenge with this activity that combines graphing practice with money!
Second Grade
Data and Graphing
Activity
Math + Love = Valentine's Day Bar Graph
Lesson Plan
Math + Love = Valentine's Day Bar Graph
Second Grade
Data and Graphing
What's more romantic than a bar graph on Valentine's Day? In this Valentine's Day lesson plan, students will use information from a data set to create their own tally charts and bar graphs and then analyze these graphs to answer questions.
Lesson Plan
Math + Love = Valentine's Day Bar Graph
Lesson Plan
Math + Love = Valentine's Day Bar Graph
What's more romantic than a bar graph on Valentine's Day? In this Valentine's Day lesson plan, students will use information from a data set to create their own tally charts and bar graphs and then analyze these graphs to answer questions.
Second Grade
Data and Graphing
Lesson Plan
Do We Wear the Same Colors?
Activity
Do We Wear the Same Colors?
Third Grade
Data and Graphing
Hone observational skills and introduce the basics of data interpretation with this data gathering activity all about the different colors people wear.
Activity
Do We Wear the Same Colors?
Activity
Do We Wear the Same Colors?
Hone observational skills and introduce the basics of data interpretation with this data gathering activity all about the different colors people wear.
Third Grade
Data and Graphing
Activity
Draw a Birthday Bar Graph
Activity
Draw a Birthday Bar Graph
Third Grade
Data and Graphing
Liven up a lesson about graphing by helping your third grader compile a bar graph from his classmates' birthday data.
Activity
Draw a Birthday Bar Graph
Activity
Draw a Birthday Bar Graph
Liven up a lesson about graphing by helping your third grader compile a bar graph from his classmates' birthday data.
Third Grade
Data and Graphing
Activity
Game of Chance
Activity
Game of Chance
Third Grade
Data and Graphing
This fun math card game is a great opportunity to discuss probability with your third grader.
Activity
Game of Chance
Activity
Game of Chance
This fun math card game is a great opportunity to discuss probability with your third grader.
Third Grade
Data and Graphing
Activity
Leprechaun Chase
Activity
Leprechaun Chase
Third Grade
Geometry
This St. Patrick's day, stretch your third grader's social studies and math skills with this fun, cooperative learning game.
Activity
Leprechaun Chase
Activity
Leprechaun Chase
This St. Patrick's day, stretch your third grader's social studies and math skills with this fun, cooperative learning game.
Third Grade
Geometry
Activity
Graphing Colored Counters
Lesson Plan
Graphing Colored Counters
Kindergarten
Data and Graphing
In this lesson, your students will use the background knowledge that they have about counting and sorting to graph data. They will practice answering questions about the graph!
Lesson Plan
Graphing Colored Counters
Lesson Plan
Graphing Colored Counters
In this lesson, your students will use the background knowledge that they have about counting and sorting to graph data. They will practice answering questions about the graph!
Kindergarten
Data and Graphing
Lesson Plan
Bike Pictograph Questions
Worksheet
Bike Pictograph Questions
Second Grade
Data and Graphing
With these pictograph questions, your kid will hone his skills at reading and interpreting graphs.
Worksheet
Bike Pictograph Questions
Worksheet
Bike Pictograph Questions
With these pictograph questions, your kid will hone his skills at reading and interpreting graphs.
Second Grade
Data and Graphing
Worksheet
Christmas Graphing
Worksheet
Christmas Graphing
Second Grade
Data and Graphing
Use a pictograph to find out how many presents Minnie wrapped this year.
Worksheet
Christmas Graphing
Worksheet
Christmas Graphing
Use a pictograph to find out how many presents Minnie wrapped this year.
Second Grade
Data and Graphing
Worksheet
Probability Game
Activity
Probability Game
Third Grade
Data and Graphing
Probability can be a tough concept to master. Try playing this fun card game in order to help your third grader understand it a little better.
Activity
Probability Game
Activity
Probability Game
Probability can be a tough concept to master. Try playing this fun card game in order to help your third grader understand it a little better.
Third Grade
Data and Graphing
Activity
Pitch and Hit Data
Activity
Pitch and Hit Data
Third Grade
Data and Graphing
Okay, engaging in a graphing activity may sound ho-hum, but if you use fun data, it changes the picture entirely.
Activity
Pitch and Hit Data
Activity
Pitch and Hit Data
Okay, engaging in a graphing activity may sound ho-hum, but if you use fun data, it changes the picture entirely.
Third Grade
Data and Graphing
Activity
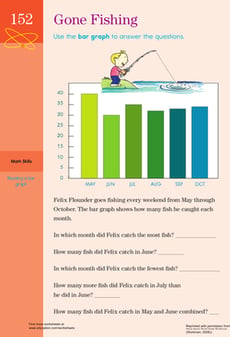
Getting Graphs: Gone Fishing!
Worksheet
Getting Graphs: Gone Fishing!
Third Grade
Data and Graphing
Hunting for a worksheet to help your kid with graphs? This printable helps your child to understand bar graphs.
Worksheet
Getting Graphs: Gone Fishing!
Worksheet
Getting Graphs: Gone Fishing!
Hunting for a worksheet to help your kid with graphs? This printable helps your child to understand bar graphs.
Third Grade
Data and Graphing
Worksheet
How to Make a Bar Graph with BBQ Food
Worksheet
How to Make a Bar Graph with BBQ Food
Second Grade
Data and Graphing
Great food never goes out of style. Find out what the most popular barbecue foods are with this bar graph that teaches kids how to interpret data.
Worksheet
How to Make a Bar Graph with BBQ Food
Worksheet
How to Make a Bar Graph with BBQ Food
Great food never goes out of style. Find out what the most popular barbecue foods are with this bar graph that teaches kids how to interpret data.
Second Grade
Data and Graphing
Worksheet
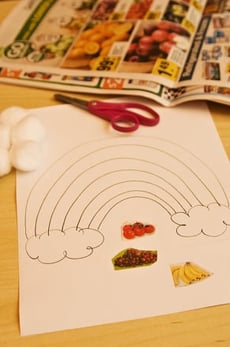
Create a Rainbow of Healthy Food
Activity
Create a Rainbow of Healthy Food
Pre-K
Data and Graphing
Help your preschooler chart her good eating habits with this arts and crafts activity that has her making a healthy fruits and vegetables rainbow and graph!
Activity
Create a Rainbow of Healthy Food
Activity
Create a Rainbow of Healthy Food
Help your preschooler chart her good eating habits with this arts and crafts activity that has her making a healthy fruits and vegetables rainbow and graph!
Pre-K
Data and Graphing
Activity
Make a Family Fridge Graph
Activity
Make a Family Fridge Graph
First Grade
Data and Graphing
Make a fun refrigerator graph with your first grader in order to help her develop those crucial graphing skills, while engaging with the whole family.
Activity
Make a Family Fridge Graph
Activity
Make a Family Fridge Graph
Make a fun refrigerator graph with your first grader in order to help her develop those crucial graphing skills, while engaging with the whole family.
First Grade
Data and Graphing
Activity
1
2
3
4