SKIP TO CONTENT
Worksheet Generator
Subjects
Grades
Worksheets
Games
Build a Worksheet
More Resources
Roly Recommends
Subjects
Grades
Worksheets
Games
Build a Worksheet
More Resources
Roly Recommends
Filters
Search for: interpretting, data, using, graphs, recipes
✕
1st - 5th Grade
✕
Common Core
✕
Subjects
Math
English Language Arts
Science
Social Studies
Grade Level
Pre-K
K
1st
2nd
3rd
4th
5th
6th
7th
8th
Early Childhood
Elementary School
Middle School
Resource Type
Worksheets
Games
Lesson Plans
Interactive Worksheets
Workbooks
Activities
Exercises
Stories
Songs
Offline Games
Teacher Resources
See more
Occasion
Women's History Month
St. Patrick's Day
Ramadan
Passover
Spring
Easter
Earth Day
Summer
Father's Day
Independence Day
Back to School
Labor Day
Fall
Hispanic Heritage Month
Halloween
Winter
Holidays
Thanksgiving
Christmas
Hanukkah
Martin Luther King Jr. Day
Valentine's Day
Presidents' Day
Black History Month
See more
Common Core
Yes
No
Roly Recommends
Social Emotional Learning
Game Type
Mazes
Dot to Dot
Crossword
Group Games
Printable Board Games
Puzzles & Sudoku
Word Puzzles
Word Search
Arts & Crafts
Arts & Crafts
Paper & Glue Crafts
Painting & Drawing
Coloring
Yes
Recipes
Mains
Sides
English Language Support
Yes
See More
Clear All
View 3,481 results
Showing Results for interpretting data using graphs recipes
3,481 results
Search for: interpretting, data, using, graphs, recipes
✕
1st - 5th Grade
✕
Common Core
✕
Clear All
Sort by:
Relevance
Most recent
Most popular
Alphabetical A-Z
Alphabetical Z-A
All filters
3,481 results
Sort by:
Relevance
Most recent
Most popular
Alphabetical A-Z
Alphabetical Z-A
Bar Graphs: Interpreting Data
Lesson Plan
Bar Graphs: Interpreting Data
Second Grade
Data and Graphing
In this lesson, students will make bar graphs and interpret data using real-life data from other students. They will get practice writing and answering survey questions.
Lesson Plan
Bar Graphs: Interpreting Data
Lesson Plan
Bar Graphs: Interpreting Data
In this lesson, students will make bar graphs and interpret data using real-life data from other students. They will get practice writing and answering survey questions.
Second Grade
Data and Graphing
Lesson Plan
Interpreting Data by Creating Graphs
Lesson Plan
Interpreting Data by Creating Graphs
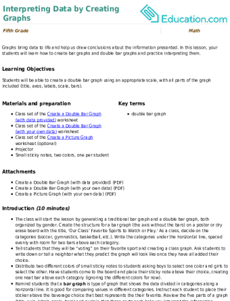
Fifth Grade
Graphs bring data to life and help us draw conclusions about the information presented. In this lesson, your students will learn how to create bar graphs and double bar graphs and practice interpreting them.
Lesson Plan
Interpreting Data by Creating Graphs
Lesson Plan
Interpreting Data by Creating Graphs
Graphs bring data to life and help us draw conclusions about the information presented. In this lesson, your students will learn how to create bar graphs and double bar graphs and practice interpreting them.
Fifth Grade
Lesson Plan
Data and Graphing
Workbook
Data and Graphing
Third Grade
Data and Graphing
Become a master of analysis! In this series, kids practice collecting, creating and plotting data on graphs. Then they'll practice reading graphs, making predictions, and comparing data.
Workbook
Data and Graphing
Workbook
Data and Graphing
Become a master of analysis! In this series, kids practice collecting, creating and plotting data on graphs. Then they'll practice reading graphs, making predictions, and comparing data.
Third Grade
Data and Graphing
Workbook
Using Election Data
Worksheet
Using Election Data
Second Grade
Data and Graphing
Practice reading election data with this data analysis worksheet!
Worksheet
Using Election Data
Worksheet
Using Election Data
Practice reading election data with this data analysis worksheet!
Second Grade
Data and Graphing
Worksheet
Data Learning Check
Worksheet
Data Learning Check
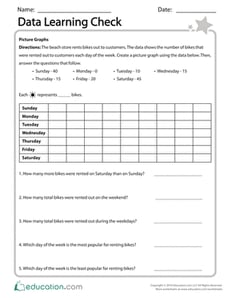
Third Grade
Data and Graphing
Use this resource to assess your students’ mastery of concepts surrounding data and graphs.
Worksheet
Data Learning Check
Worksheet
Data Learning Check
Use this resource to assess your students’ mastery of concepts surrounding data and graphs.
Third Grade
Data and Graphing
Worksheet
Let’s Talk About Data!
Lesson Plan
Let’s Talk About Data!
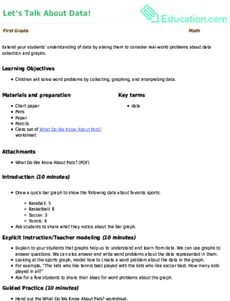
First Grade
Math
Extend your students' understanding of data by asking them to consider real-world problems about data collection and graphs.
Lesson Plan
Let’s Talk About Data!
Lesson Plan
Let’s Talk About Data!
Extend your students' understanding of data by asking them to consider real-world problems about data collection and graphs.
First Grade
Math
Lesson Plan
Gathering Data
Worksheet
Gathering Data
Third Grade
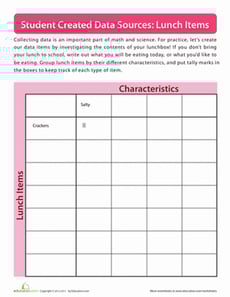
The first step in graphing is learning to organize and collect data. Practice gathering data by using the items in your lunchbox as your data source.
Worksheet
Gathering Data
Worksheet
Gathering Data
The first step in graphing is learning to organize and collect data. Practice gathering data by using the items in your lunchbox as your data source.
Third Grade
Worksheet
Collecting Data
Worksheet
Collecting Data
Third Grade
Data and Graphing
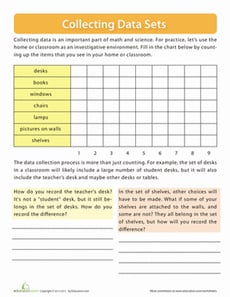
Collecting data is an important part of math and statistics. Practice gathering data using items around the house or classroom!
Worksheet
Collecting Data
Worksheet
Collecting Data
Collecting data is an important part of math and statistics. Practice gathering data using items around the house or classroom!
Third Grade
Data and Graphing
Worksheet
EL
Let's Collect Data!
Lesson Plan
Let's Collect Data!
Second Grade
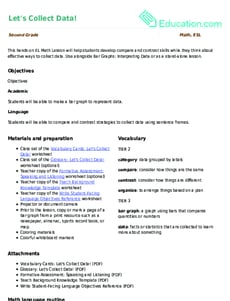
This hands-on EL Math Lesson will help students develop compare and contrast skills while they think about effective ways to collect data. Use alongside Bar Graphs: Interpreting Data or as a stand-alone lesson.
Lesson Plan
EL
Let's Collect Data!
Lesson Plan
Let's Collect Data!
This hands-on EL Math Lesson will help students develop compare and contrast skills while they think about effective ways to collect data. Use alongside Bar Graphs: Interpreting Data or as a stand-alone lesson.
Second Grade
Lesson Plan
Practice Graphs
Worksheet
Practice Graphs
Second Grade
Data and Graphing
Kids practice representing a set of data using three kinds of graphs: a bar graph, pictograph, and pie graph.
Worksheet
Practice Graphs
Worksheet
Practice Graphs
Kids practice representing a set of data using three kinds of graphs: a bar graph, pictograph, and pie graph.
Second Grade
Data and Graphing
Worksheet
Donut Data
Worksheet
Donut Data
Fifth Grade
Data and Graphing
Practice using line plots and data sets to solve math problems with this donut-themed fractions worksheet!
Worksheet
Donut Data
Worksheet
Donut Data
Practice using line plots and data sets to solve math problems with this donut-themed fractions worksheet!
Fifth Grade
Data and Graphing
Worksheet
Dive Into Data
Workbook
Dive Into Data
First Grade
Math
Math isn't just adding and subtracting—it's about making sense of numbers and information. Practice with calendars and different types of graphs to help your child dive into data!
Workbook
Dive Into Data
Workbook
Dive Into Data
Math isn't just adding and subtracting—it's about making sense of numbers and information. Practice with calendars and different types of graphs to help your child dive into data!
First Grade
Math
Workbook
Gather Data: Record Your Favorites
Worksheet
Gather Data: Record Your Favorites
Second Grade
Data and Graphing
Use this helpful math worksheet to support children in gathering and organizing data so they can create and interpret graphs.
Worksheet
Gather Data: Record Your Favorites
Worksheet
Gather Data: Record Your Favorites
Use this helpful math worksheet to support children in gathering and organizing data so they can create and interpret graphs.
Second Grade
Data and Graphing
Worksheet
Graphing Data: Tally Marks and Bar Graphs
Lesson Plan
Graphing Data: Tally Marks and Bar Graphs
First Grade
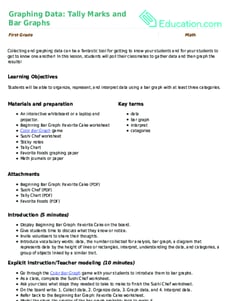
Collecting and graphing data can be a fantastic tool for getting to know your students and for your students to get to know one another! In this lesson, students will poll their classmates to gather data and then graph the results!
Lesson Plan
Graphing Data: Tally Marks and Bar Graphs
Lesson Plan
Graphing Data: Tally Marks and Bar Graphs
Collecting and graphing data can be a fantastic tool for getting to know your students and for your students to get to know one another! In this lesson, students will poll their classmates to gather data and then graph the results!
First Grade
Lesson Plan
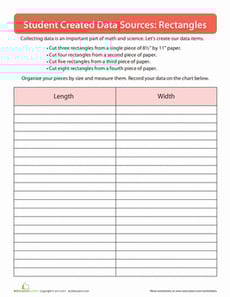
Creating Data
Worksheet
Creating Data
Third Grade
Measurement
Practice creating your own data sources in this introductory graphing activity.
Worksheet
Creating Data
Worksheet
Creating Data
Practice creating your own data sources in this introductory graphing activity.
Third Grade
Measurement
Worksheet
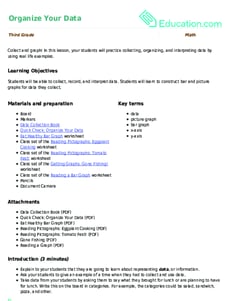
Organize Your Data
Lesson Plan
Organize Your Data
Third Grade
Collect and graph! In this lesson, your students will practice collecting, organizing, and interpreting data by using real life examples.
Lesson Plan
Organize Your Data
Lesson Plan
Organize Your Data
Collect and graph! In this lesson, your students will practice collecting, organizing, and interpreting data by using real life examples.
Third Grade
Lesson Plan
Scaled Bar Graphs
Exercise
Scaled Bar Graphs
Third Grade
Data and Graphing
This exercise will clarify just how scaled bar graphs represent data found in math problems.
Exercise
Scaled Bar Graphs
Exercise
Scaled Bar Graphs
This exercise will clarify just how scaled bar graphs represent data found in math problems.
Third Grade
Data and Graphing
Exercise
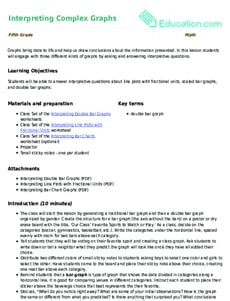
Interpreting Complex Graphs
Lesson Plan
Interpreting Complex Graphs
Fifth Grade
Math
Graphs bring data to life and help us draw conclusions about the information presented. In this lesson students will engage with three different kinds of graphs by asking and answering interpretive questions.
Lesson Plan
Interpreting Complex Graphs
Lesson Plan
Interpreting Complex Graphs
Graphs bring data to life and help us draw conclusions about the information presented. In this lesson students will engage with three different kinds of graphs by asking and answering interpretive questions.
Fifth Grade
Math
Lesson Plan
Interpreting Line Plots, Bar Graphs and Picture Graphs: Word Problems
Lesson Plan
Interpreting Line Plots, Bar Graphs and Picture Graphs: Word Problems
Third Grade
Graphs bring data to life and help us draw conclusions about the information. In this lesson, students will engage with three different kinds of graphs by asking and answering interpretive questions.
Lesson Plan
Interpreting Line Plots, Bar Graphs and Picture Graphs: Word Problems
Lesson Plan
Interpreting Line Plots, Bar Graphs and Picture Graphs: Word Problems
Graphs bring data to life and help us draw conclusions about the information. In this lesson, students will engage with three different kinds of graphs by asking and answering interpretive questions.
Third Grade
Lesson Plan
Measurement & Data Check-Up
Worksheet
Measurement & Data Check-Up
Third Grade
Geometry
Use this resource to assess your students’ mastery of concepts surrounding measurement and data.
Worksheet
Measurement & Data Check-Up
Worksheet
Measurement & Data Check-Up
Use this resource to assess your students’ mastery of concepts surrounding measurement and data.
Third Grade
Geometry
Worksheet
Comparing Sets of Data
Worksheet
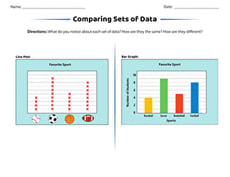
Comparing Sets of Data
Second Grade
Data and Graphing
Want to help your students begin to think critically about data? Laminate and display this worksheet to spark discussion about different ways to represent data.
Worksheet
Comparing Sets of Data
Worksheet
Comparing Sets of Data
Want to help your students begin to think critically about data? Laminate and display this worksheet to spark discussion about different ways to represent data.
Second Grade
Data and Graphing
Worksheet
Measurement & Data Review
Worksheet
Measurement & Data Review
Fifth Grade
Fractions
Assess your students’ knowledge of fifth grade data and measurement concepts.
Worksheet
Measurement & Data Review
Worksheet
Measurement & Data Review
Assess your students’ knowledge of fifth grade data and measurement concepts.
Fifth Grade
Fractions
Worksheet
Collect & Represent Data
Worksheet
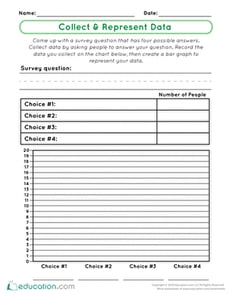
Collect & Represent Data
First Grade
Data and Graphing
Use this activity to assess your students’ abilities to collect and represent data. Students will come up with a survey question, collect and record the data, and then create a bar graph to represent the survey results.
Worksheet
Collect & Represent Data
Worksheet
Collect & Represent Data
Use this activity to assess your students’ abilities to collect and represent data. Students will come up with a survey question, collect and record the data, and then create a bar graph to represent the survey results.
First Grade
Data and Graphing
Worksheet
Bar Graphs: Favorite Sport
Worksheet
Bar Graphs: Favorite Sport
Second Grade
Data and Graphing
Math buffs and sports buffs alike, here's a great intro to graphing worksheet! Your student will get practice making bar graphs from provided data.
Worksheet
Bar Graphs: Favorite Sport
Worksheet
Bar Graphs: Favorite Sport
Math buffs and sports buffs alike, here's a great intro to graphing worksheet! Your student will get practice making bar graphs from provided data.
Second Grade
Data and Graphing
Worksheet
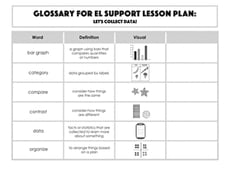
Glossary: Let's Collect Data!
Worksheet
Glossary: Let's Collect Data!
Second Grade
Data and Graphing
Use this glossary with the EL Support Lesson Plan: Let's Collect Data!
Worksheet
Glossary: Let's Collect Data!
Worksheet
Glossary: Let's Collect Data!
Use this glossary with the EL Support Lesson Plan: Let's Collect Data!
Second Grade
Data and Graphing
Worksheet
Father's Day Recipes
Worksheet
Father's Day Recipes
Fourth Grade
Writing
Present your dad with this do-it-yourself book of Father's Day recipes!
Worksheet
Father's Day Recipes
Worksheet
Father's Day Recipes
Present your dad with this do-it-yourself book of Father's Day recipes!
Fourth Grade
Writing
Worksheet
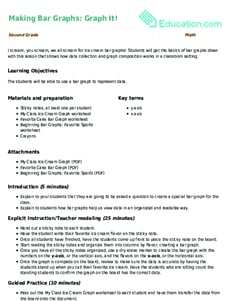
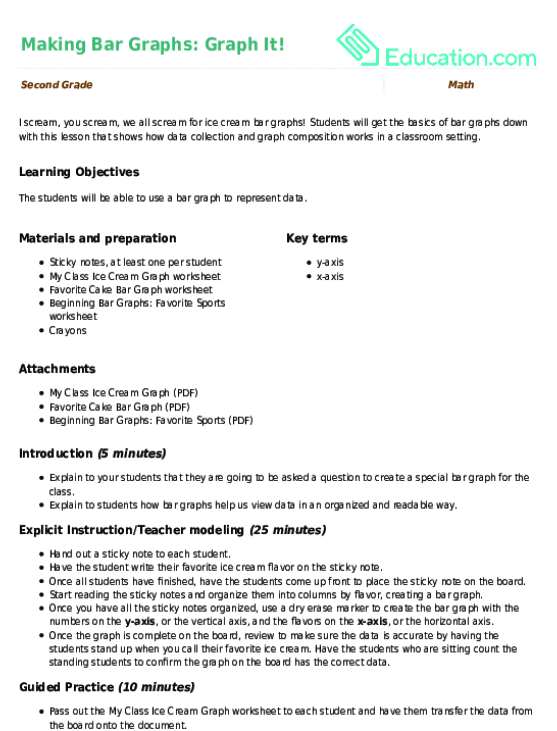
Making Bar Graphs: Graph It!
Lesson Plan
Making Bar Graphs: Graph It!
Second Grade
I scream, you scream, we all scream for ice cream bar graphs! Students will get the basics of bar graphs down with this lesson that shows how data collection and graph composition works in a classroom setting.
Lesson Plan
Making Bar Graphs: Graph It!
Lesson Plan
Making Bar Graphs: Graph It!
I scream, you scream, we all scream for ice cream bar graphs! Students will get the basics of bar graphs down with this lesson that shows how data collection and graph composition works in a classroom setting.
Second Grade
Lesson Plan
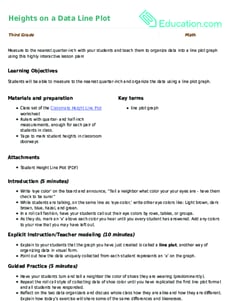
Heights on a Data Line Plot
Lesson Plan
Heights on a Data Line Plot
Third Grade
Measure to the nearest quarter-inch with your students and teach them to organize data into a line plot graph using this highly interactive lesson plan!
Lesson Plan
Heights on a Data Line Plot
Lesson Plan
Heights on a Data Line Plot
Measure to the nearest quarter-inch with your students and teach them to organize data into a line plot graph using this highly interactive lesson plan!
Third Grade
Lesson Plan
Asking and Answering Questions about Line Plots and Bar Graphs
Lesson Plan
Asking and Answering Questions about Line Plots and Bar Graphs
Third Grade
Take students’ understanding of bar graphs and line plots to the next level. This lesson will encourage students to think about how graphs are designed and the questions we can ask and answer about data presented in graphs.
Lesson Plan
Asking and Answering Questions about Line Plots and Bar Graphs
Lesson Plan
Asking and Answering Questions about Line Plots and Bar Graphs
Take students’ understanding of bar graphs and line plots to the next level. This lesson will encourage students to think about how graphs are designed and the questions we can ask and answer about data presented in graphs.
Third Grade
Lesson Plan
Let’s Find Out! Answering Questions by Collecting and Organizing Data
Lesson Plan
Let’s Find Out! Answering Questions by Collecting and Organizing Data
Third Grade
Your students will practice data collection and graphing while learning more about each other. Your data scientists will craft a survey question, collect data from the class, and then create a bar graph to represent their findings.
Lesson Plan
Let’s Find Out! Answering Questions by Collecting and Organizing Data
Lesson Plan
Let’s Find Out! Answering Questions by Collecting and Organizing Data
Your students will practice data collection and graphing while learning more about each other. Your data scientists will craft a survey question, collect data from the class, and then create a bar graph to represent their findings.
Third Grade
Lesson Plan
1
2
3
4
…
117